

Regression Channel Sketcher
April 22, 2016, 3:24 PM
Indicators
4 Comments
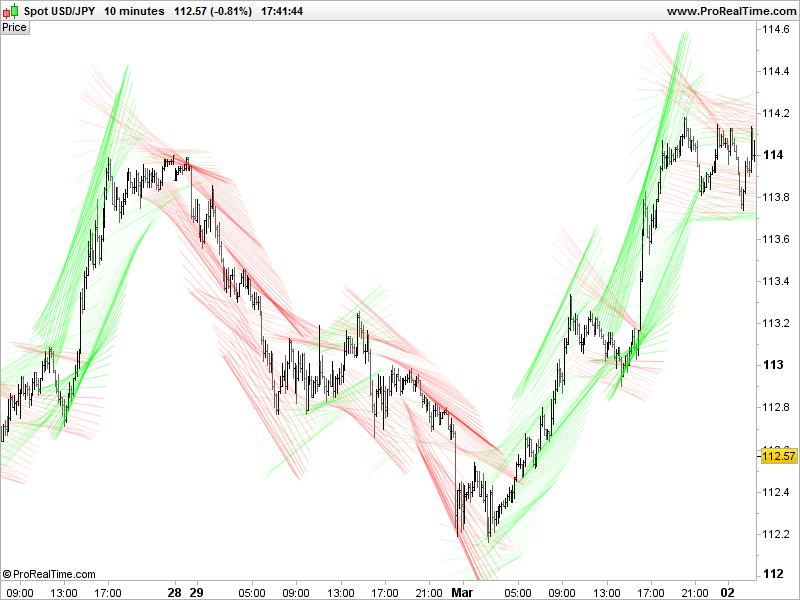
I have seen something similar elsewhere recently so i decided to make my own version of this channel sketcher for the new ProRealTime 10.3 version with the new “DRAWSEGMENT” function.
This is a regression channel sketcher that draw segment other highs and lows over a ‘p’ period (20 by default).
The alpha gradient is calculated with the difference between the top and bottom channel to made it easier to “read”.
This indicator is more an attempt to demonstrate new graphical capabilities of the platform, than to use it for real trading, but it can be 🙂
p=20

z1 = linearregression[p](high)
z2 = linearregression[p](low)

y1 = 1.5*std[p](high)+z1
y2 = 1.5*-std[p](low)+z2

if(y1>y1[p]) then
  Rh = 0
  Gh = 255
else
  Rh = 255
  Gh = 0
endif

if(y2>y2[p]) then
  Rl = 0
  Gl = 255
else
  Rl = 255
  Gl = 0
endif

a = (255*(y1-y2))/(300*pipsize)
if a>255 then
  a = 255
endif

DRAWSEGMENT(barindex-p*1.5,y1[p],barindex+10,y1)coloured(Rh,Gh,0,a)
DRAWSEGMENT(barindex-p*1.5,y2[p],barindex+10,y2)coloured(Rl,Gl,0,a)

RETURN
Download
Filename:
Channel-Sketcher.itf
Downloads:
175
Master
I created ProRealCode because I believe in the power of shared knowledge. I spend my time coding new tools and helping members solve complex problems.
If you are stuck on a code or need a fresh perspective on a strategy, I am always willing to help. Welcome to the community!
Author’s Profile
Loading...