

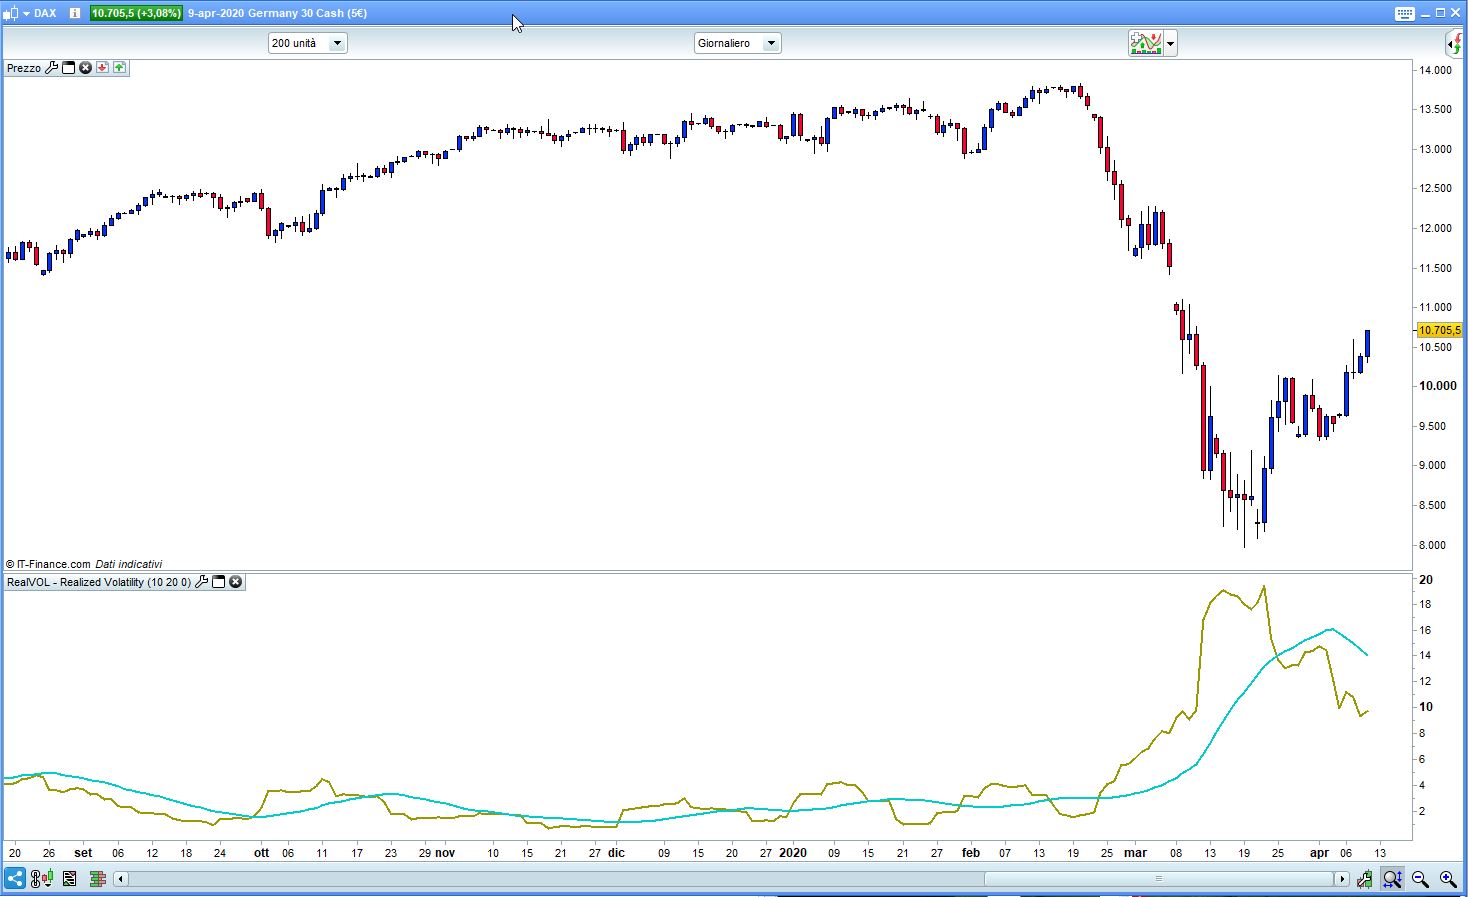
Realized Volatility
April 13, 2020, 10:41 AM
Indicators
4 Comments
Searching the internet for Volatility, I found some references to this indicator and decided to code it, adding an average to it:
https://www.realvol.com/VolFormula.htm
https://www.realvol.com/VolatilityFormula2.html
https://www.wallstreetmojo.com/realized-volatility/
https://journals.plos.org/plosone/article?id=10.1371/journal.pone.0102940
I hope its formula has been correctly coded. Should you spot any mistake, please let me know.
If you prefer not to have the MA plotted, you may make it invisible with its properties, once installed in ProBuilder.
// RealVol - Realized Volatility
//
// https://www.realvol.com/VolFormula.htm
// https://www.realvol.com/VolatilityFormula2.html
// https://www.wallstreetmojo.com/realized-volatility/
// https://journals.plos.org/plosone/article?id=10.1371/journal.pone.0102940
//
//Periods   = 10
//MAperiods = 20
//MAtype    = 0                                          //0=sma, 1=eama, etc...
Periods     = max(1,min(999,Periods))
MAperiods   = max(1,min(999,MAperiods))
MAtype      = max(0,min(6,MAtype))
IF BarIndex > 0 THEN
   R       = Log(close) - Log(close[1])                  //or   Log(close / close[1])
   VolReal = Sqrt(summation[Periods](Square(R))) * 100
   Avg     = Average[MAperiods,MAtype](VolReal)
ENDIF
RETURN VolReal AS "Realized Volatility",Avg AS "RV Average"
Download
Filename:
ReaVol-Realized-Volatility.txt
Downloads:
34
Download
Filename:
RealVOL-Realized-Volatility.itf
Downloads:
193
Download
Filename:
RealVol.jpg
Downloads:
35

Master
Roberto
https://www.ots-onlinetradingsoftware.com
Author’s Profile
Loading...