

Real Motion Indicator
May 27, 2021, 8:21 AM
Indicators
4 Comments
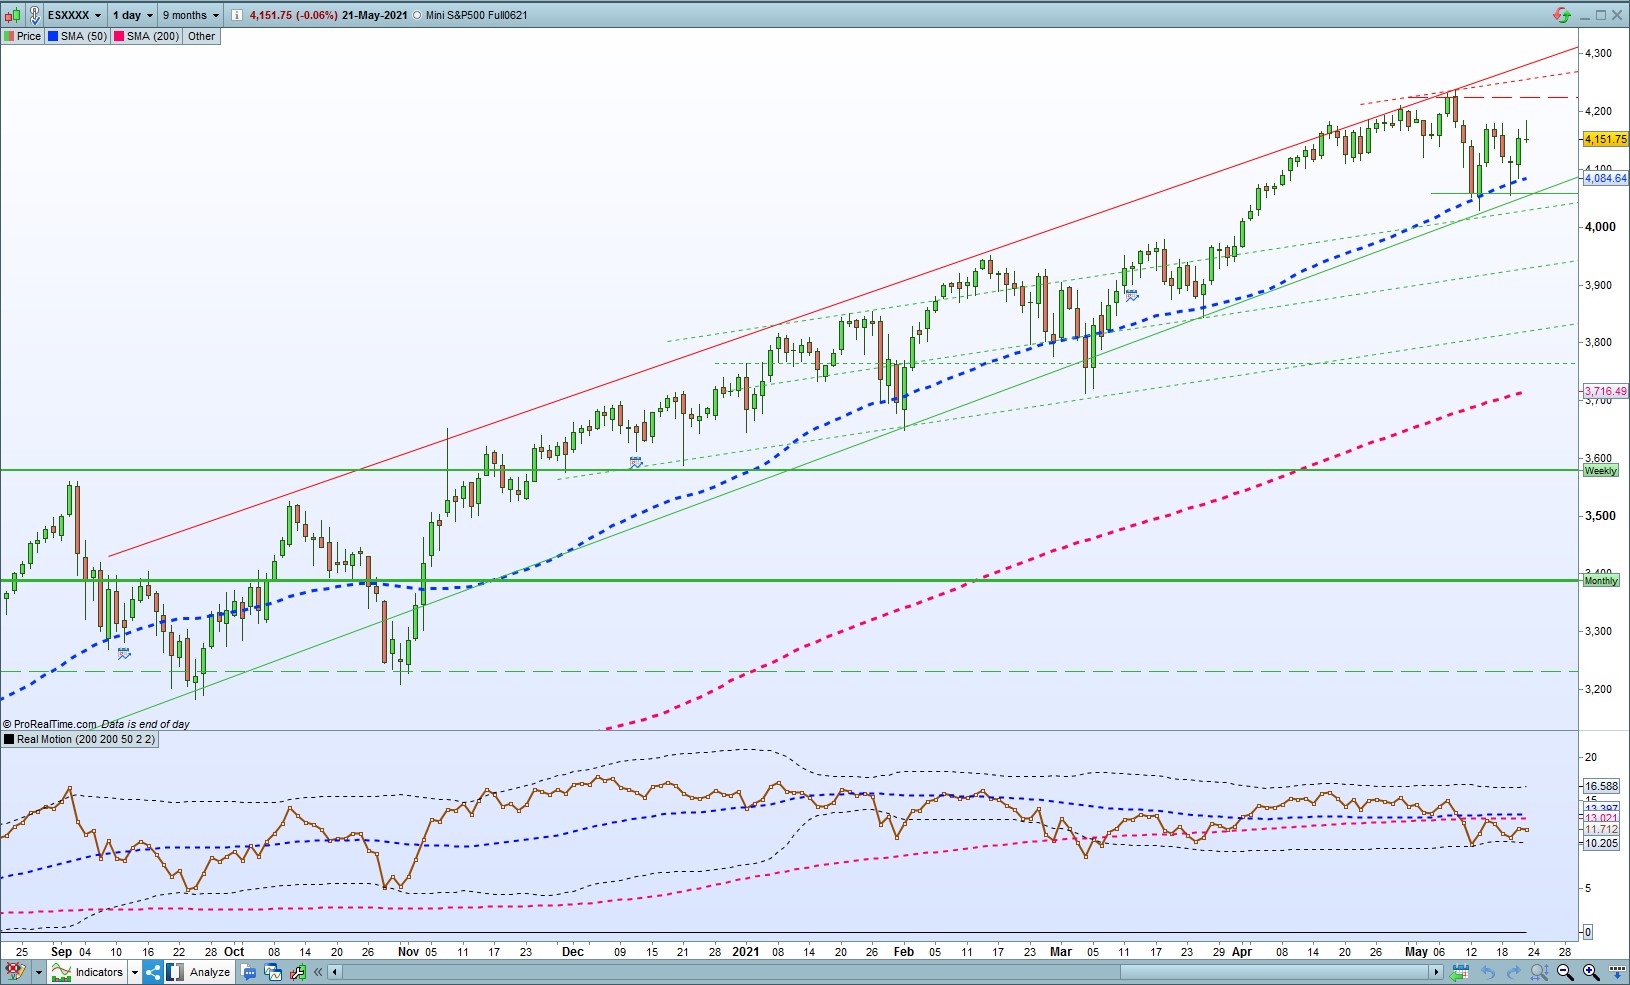
RealMotion indicator as explained by Market Gauge
“The brown dots are a dot plot of the individual values of the RealMotion variable. Essentially, they divide the equity price by the moving average of that price (here 200 period). We then subtract one and multiply that value by 100. This centers the indicator at zero (when price = moving average then RealMotion will equal zero). Furthermore, by multiplying by 100 we make it so that when RealMotion = 5.0 we can say that the price is 5% greater than the reference moving average.”
// Real Motion indicator (a Market Gauge indicator)
//ported to Prorealtime by ciccio
//
//Default Values:
//PrimaryAverage=200
//RealMotionAverageSlow=200
//RealMotionAverageFast=50
//NumDevsUp=2
//NumDevsDn=2
//
//BaseLine represents 200 days SMA of price closes
BaseLine=0

//RealMotion indicator as explained by Market Gauge
//"The brown dots are a dot plot of the individual values of the RealMotion variable.
//Essentially, they divide the equity price by the moving average of that price (here 200 period).
//We then subtract one and multiply that value by 100.
//This centers the indicator at zero (when price = moving average then RealMotion will equal zero).
//Furthermore, by multiplying by 100 we make it so that when RealMotion = 5.0
//we can say that the price is 5% greater than the reference moving average."
PrimaryAveragePlot=Average[PrimaryAverage](close)
RealMotion=(close/PrimaryAveragePlot - 1)*100

SlowRealMotion=Average[RealMotionAverageSlow](RealMotion)
FastRealMotion=Average[RealMotionAverageFast](RealMotion)

//Bollinger Bands
fUpperBand = FastRealMotion + ((STD[RealMotionAverageFast](RealMotion)) * NumDevsUp)
fLowerBand = FastRealMotion - ((STD[RealMotionAverageFast](RealMotion)) * NumDevsDn)

//Plotting
Return RealMotion COLOURED(150,75,0) AS "Real Motion", SlowRealMotion COLOURED(255,0,102) AS "SlowRealMotion", FastRealMotion COLOURED(0,0,255) AS "FastRealMotion", fLowerBand COLOURED(0,0,0) AS "fLowerBand", fUpperBand COLOURED(0,0,0) AS "fUpperBand", BaseLine COLOURED(0,0,0) AS "BaseLine"
Download
Filename:
Real-Motion-indicator.itf
Downloads:
151

Master
Code artist, my biography is a blank page waiting to be scripted. Imagine a bio so awesome it hasn't been coded yet.
Author’s Profile
Loading...