

RB-BBTrader
November 7, 2017, 1:39 PM
Indicators
17 Comments
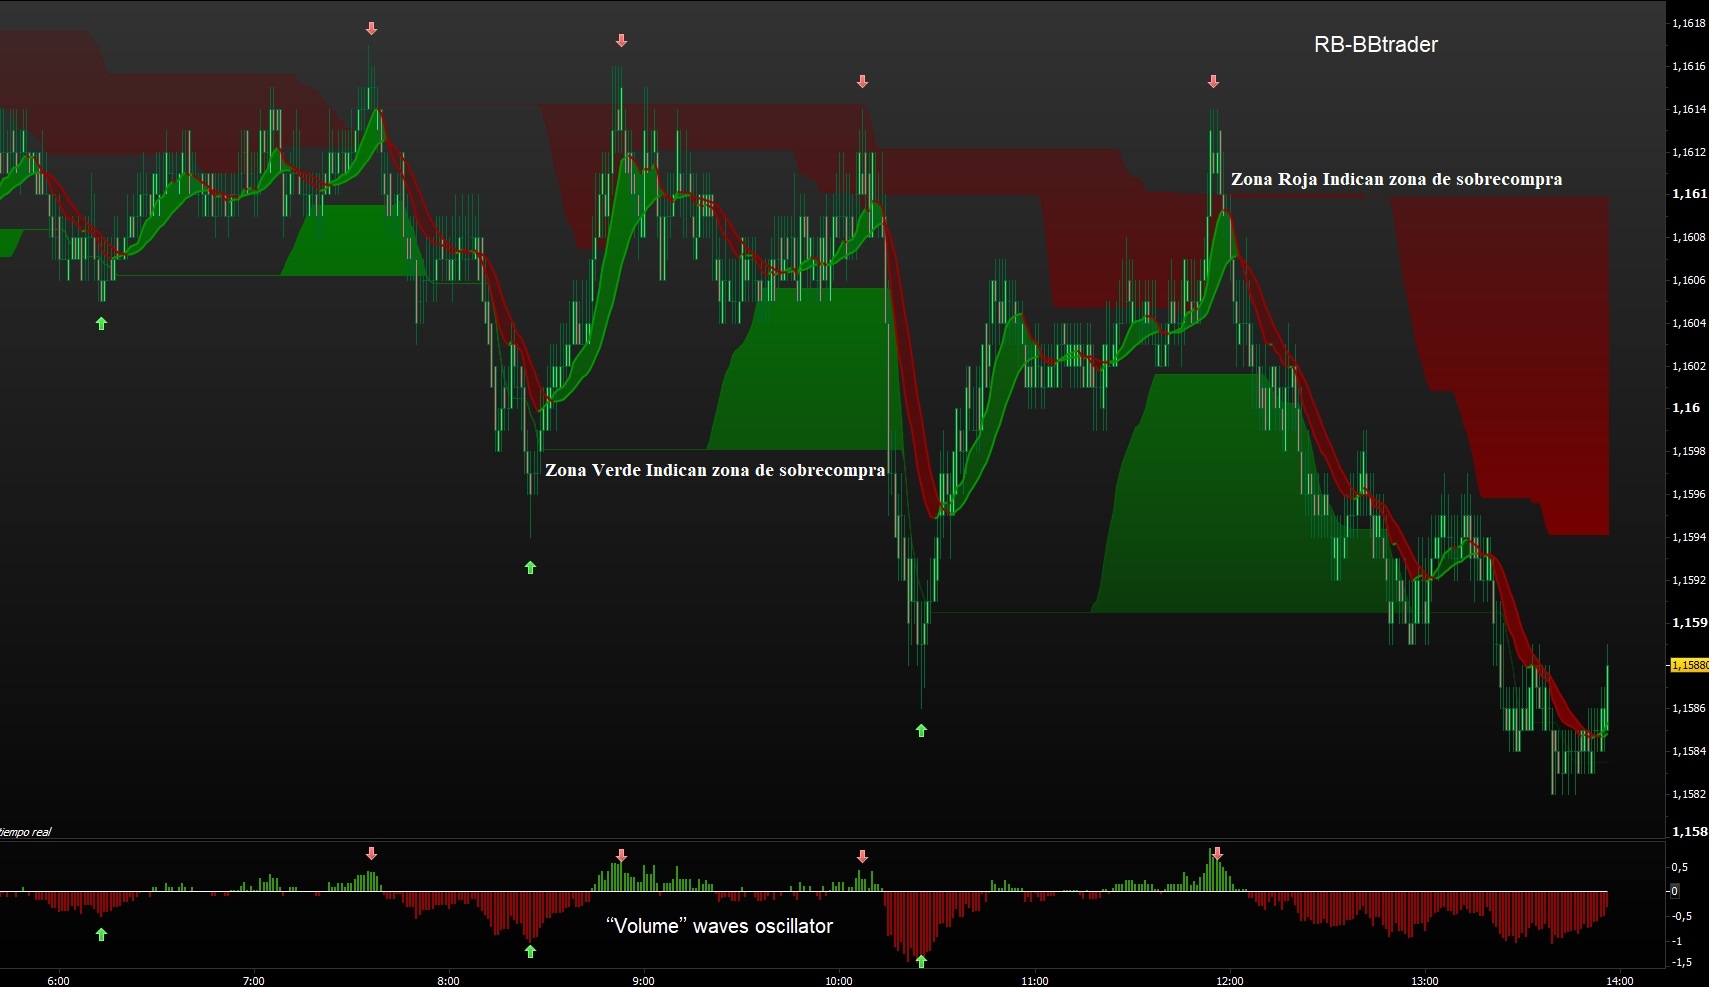
This post is about a trading system that combine 2 indicators, the configuration of the indicators are explained below (to be like the screenshot). I also add a PDF that explain how to get the same look and feel than me, for every line and for color zones too.
Configuration
Hide maximum, minimum, maximum1, minimum1
Trader: Green Bullish, Red Bear
BBsignal: Green Bullish, Red Bass Player
Add 3 color zones are added:
- maximum1 <> maximum
- Minimum1 <> Minimum
- Trader <> BBsignal
Indicator based on supports and resistances that is combined with “Volume” waves osc:
- Green Zone Indicates overselling area.
- Red Zone Indicates overbought area.
//Definimos trader

p= Average[8]
maximo=highest[150](p)
minimo=lowest[150](p)
maximo1=highest[50](p)
minimo1=lowest[50](p)
BB = ExponentialAverage[12]((close))
BBsignal = ExponentialAverage[12](BB)

Trader = bb + 1*STD[8](BBsignal)

return trader as "trader",BBsignal as "BBsignal", maximo as "maximo",minimo as "minimo",maximo1 as "maximo1",minimo1 as "minimo1"
“Volume” waves oscillator. Synchronize the entry with the price change in the supports giving the entry:
- Buy signal: BBtrader over BBSignal
- Sellshort signal: BBSignal over BBtrader
//RB@72 @
//Oscilador de Volumen "Volume" waves oscillator
cero=0

Onda = Weightedaverage [150] (close)
Wave= ((close/Onda)-1)*100


return Wave*10 as "Vol-Ex",cero coloured (0, 0, 0) as "cero"
Download
Filename:
RB-BBTrader-2.itf
Downloads:
568
Download
Filename:
RB-Volumne-v1-2.itf
Downloads:
519
Download
Filename:
ConfiguracionBBTrader.pdf
Downloads:
664
Master
Analista independiente y programador de indicadores.
Author’s Profile
Loading...