

Ranked Support & Resistance Zones
Every chart has dozens of support and resistance levels, and that is exactly the problem: drawn naively, they bury the two or three that actually matter under a pile of stale, weak or already-broken lines. Ranked Support & Resistance Zones, by Zeiierman, takes a different route. Instead of plotting every pivot it finds, it scores each one, merges the ones that overlap, retires the ones price has broken, and shows you only the top-ranked handful — each painted as a zone with an internal strength gauge and a plain-language label (Strong, Weak, Mitigated).
The interesting part is the ranking engine. A zone’s score is not its age or its touch count alone; it is a weighted blend of six ingredients: how wide the zone is, how much volume printed at the pivot that created it, whether it sits on the right side of the trend, how cleanly the swing stands out, how many times price has respected it, and how old it is.
Theory Behind the Indicator
1. From pivots to zones
Everything starts with confirmed pivots. A swing high needs pivotSpan lower bars on each side before it counts (default 5); a swing low needs pivotSpan higher bars. Each confirmed pivot is then filtered by displacement: it must stick out from its immediate neighbours by at least minSwingAtr multiples of ATR. This single test throws away the micro-wiggles that would otherwise spawn dozens of meaningless levels.
A surviving pivot becomes a zone: a band of height zoneAtrWidth × ATR centred on the pivot price. A swing high becomes a resistance zone; a swing low becomes a support zone.
2. The ranking engine
This is the heart of the indicator. Each zone gets a score from 0 to 100, built from six normalised factors:
- Size — wider zones (relative to ATR) score higher, up to a cap.
- Volume — the volume that printed on the pivot bar, relative to its moving average. A level born on a volume spike matters more.
- Trend alignment — a support that sits above the trend EMA, or a resistance below it, is “with” the structure and earns a bonus.
- Swing quality — how far the pivot protrudes beyond its neighbours, in ATR units. Cleaner swings score higher.
- Touches — how many times price has revisited the zone without breaking it.
- Age decay — older zones are penalised; relevance fades with time.
The weights are fixed and deliberate: swing quality (28) and size (20) dominate, volume (18) and touches (16) follow, trend alignment (12) refines, and a flat base (10) keeps every live zone on the board. Two penalties pull the score back down — mitigation (how consumed the zone is) and age. The result is a single number that lets the indicator answer the only question that matters on a crowded chart: which levels deserve my attention right now?
3. Absorption: no duplicate levels
Real charts produce clusters of pivots at almost the same price. Rather than stack five near-identical lines, the indicator absorbs them: when a new zone overlaps an existing same-side zone — either because their midpoints are within absorbAtr × ATR, or because they overlap by more than 35 % of the smaller zone — the two are merged into one wider, stronger zone. Confluence is rewarded, clutter is removed.
4. Mitigation and breaks
A zone is not static. Each time price trades into it, the indicator measures mitigation — how deeply the zone has been filled, as a fraction of its width. A lightly tested zone stays “Strong”; a heavily filled one is relabelled “Mitigated” and its score is docked. And when price closes beyond the zone by more than breakAtr × ATR, the zone is considered broken and drops off the active board entirely. What you are left looking at is, by construction, the set of levels that are still in play.
5. The internal strength gauge
Inside each zone sit two bars whose lengths encode a bull% / bear% reading derived from the score, the trend alignment and the mitigation. A strong, unmitigated support shows a long bullish bar; once it is consumed, the bearish side grows. It is a compact way to read, at a glance, which way the zone is leaning and how much conviction is left in it.
How to Read the Indicator
- Only the survivors are shown. The board displays the top
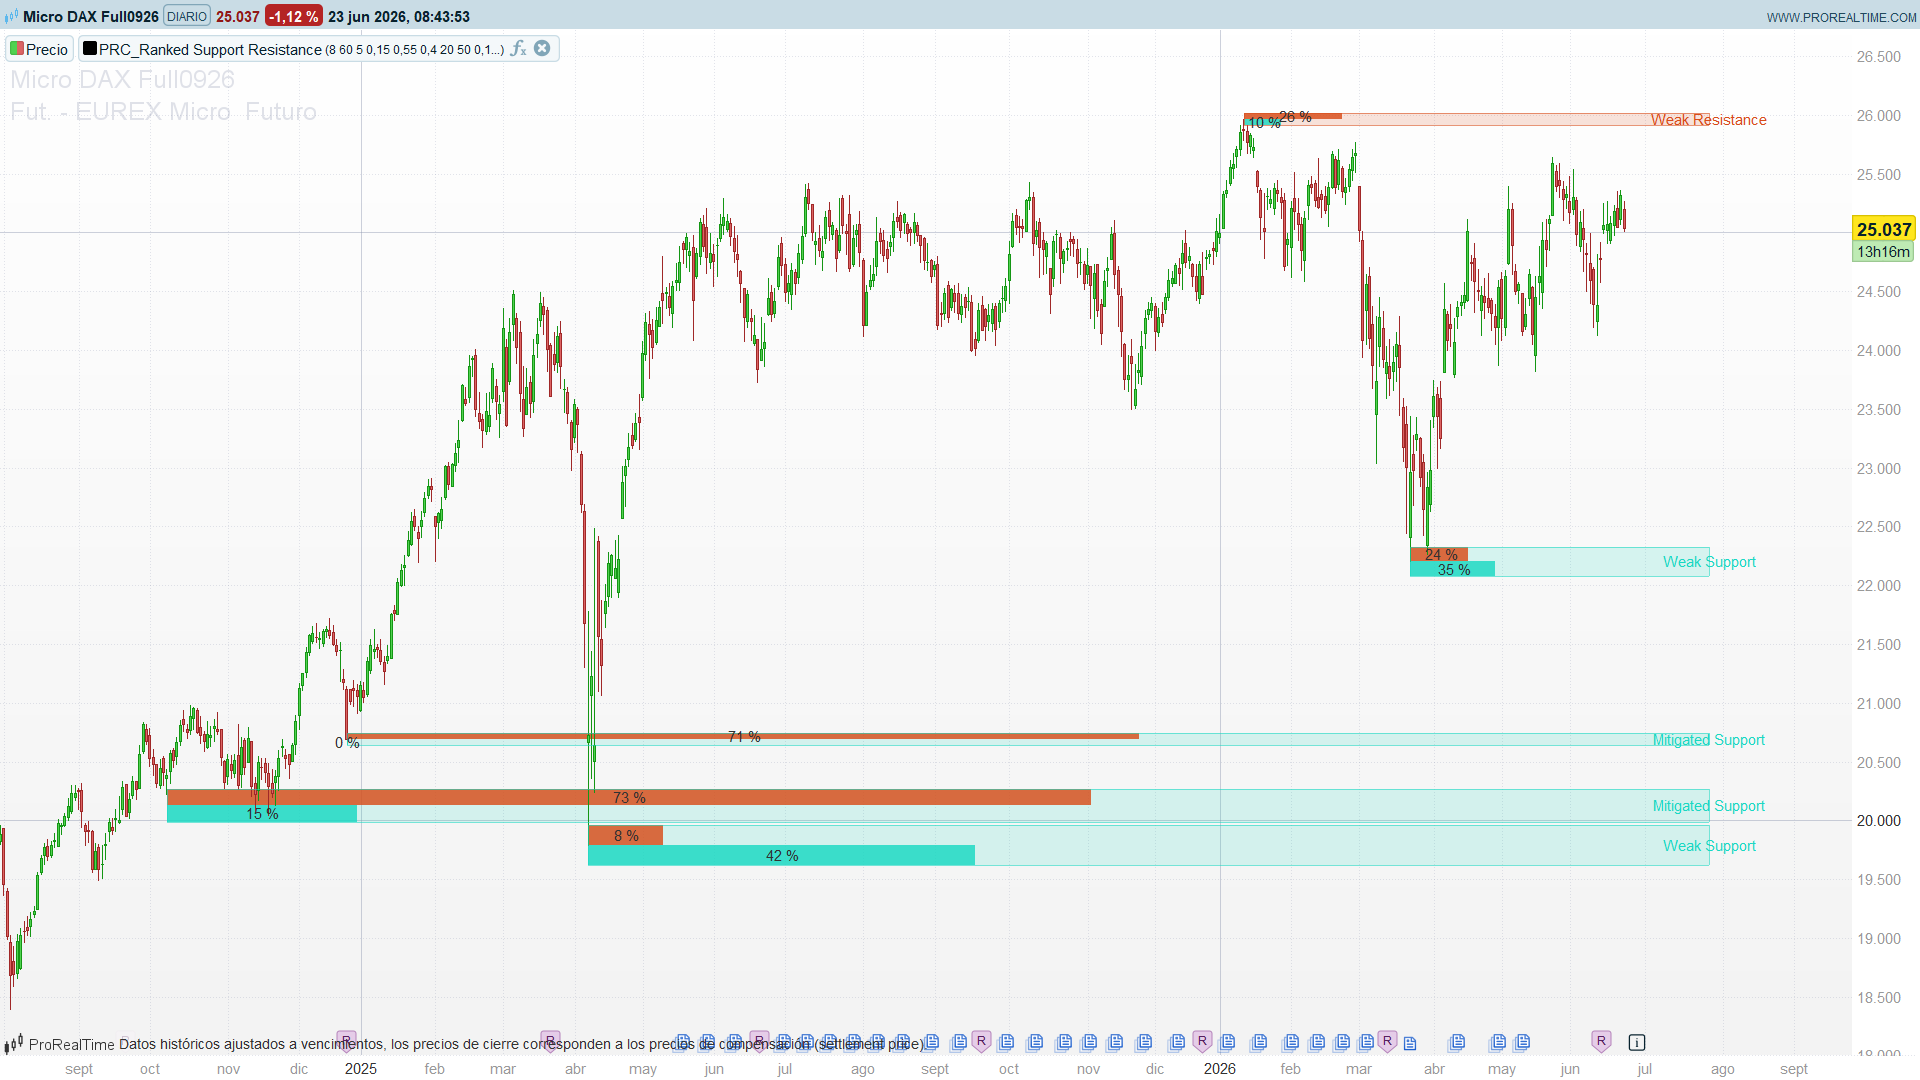
visibleLimitzones by score (default 8). If a level is on the chart, it earned its place; broken and low-ranked levels are gone. - Colour is the side. Teal zones are support, orange-red zones are resistance.
- The label is the verdict. Strong / Support / Weak grades the conviction; “Mitigated” means price has already eaten most of the zone and it is living on borrowed time.
- The internal bars are the lean. A long bullish bar on a support means a clean, respected level; a growing bearish bar means it is being worn down.
- Confluence is built in. A single wide zone where you would expect a cluster of lines is the indicator telling you several pivots agree on that price.
Practical Applications
- Triage, not decoration. Use the ranking to focus only on the few levels the engine rates highest, instead of eyeballing a chart full of equal-looking lines.
- Trade-with-trend bias. The trend-alignment factor means top-ranked supports tend to sit under uptrends and top-ranked resistances over downtrends — a natural filter for pullback entries.
- Mitigation as a warning. A zone flipping to “Mitigated” is an early sign the level is being consumed; treat bounces from it with more caution than from a fresh, strong zone.
- Confluence hunting. The widest, highest-scoring zones mark the prices where the most evidence stacks up — natural areas for reversals or for placing stops beyond.
Indicator Configuration
visibleLimit(default 8): how many top-ranked zones to display.storedLimit(default 60): how many zones to keep internally before the weakest are pruned.pivotSpan(default 5): pivot confirmation length. Higher = fewer, more confirmed levels.minSwingAtr(default 0.15): minimum pivot displacement in ATR. Raises the bar for what counts as a swing.absorbAtr(default 0.55): how close, in ATR, two zones can be before they merge.zoneAtrWidth(default 0.40): zone thickness in ATR.volLen(default 20): volume baseline length for the scoring engine.trendLen(default 50): trend EMA length for the alignment factor.breakAtr(default 0.12): how far beyond a zone price must close to break it.dirFilter(default 0): 0 = all, 1 = support only, 2 = resistance only.showBars/showText(default 1): toggle the internal strength bars and the zone labels.
Code
//--------------------------------------------------------//
// PRC_Ranked Support & Resistance Zones (by Zeiierman)
// version = 0
// 23.06.2026
// Ivan Gonzalez @ www.prorealcode.com
// Sharing ProRealTime knowledge
//--------------------------------------------------------//
defparam drawonlastbaronly = true


// ===== Inputs =====
visibleLimit = 8      // Show Top Zones (1..30)
storedLimit  = 60     // Max Stored Zones
pivotSpan    = 5      // Pivot Length
minSwingAtr  = 0.15   // Min Pivot ATR displacement
absorbAtr    = 0.55   // Absorb Similar Zones (ATR multiple)
zoneAtrWidth = 0.40   // Zone Width (ATR multiple)
volLen       = 20     // Volume MA Length
trendLen     = 50     // Trend EMA Length
breakAtr     = 0.12   // Break Close Buffer (ATR multiple)
dirFilter    = 0      // 0 = All, 1 = Support only, 2 = Resistance only
showBars     = 1      // Show internal strength bars (1/0)
showText     = 1      // Show zone label text (1/0)
maxLife      = 450    // Zone max age in bars


// ===== Colors (R, G, B) =====
supR = 26
supG = 216
supB = 194
resR = 216
resG = 76
resB = 26


// ===== Core series =====
atrRaw = averagetruerange[14](close)
IF atrRaw <= 0 THEN
   atr = pipsize * 10
ELSE
   atr = atrRaw
ENDIF
volBase   = average[volLen](volume)
trendBase = average[trendLen,1](close)


// ===== Accumulate confirmed pivots into parallel arrays (runs every bar) =====
// --- pivot HIGH -> resistance (dir = 1) ---
IF high < high[pivotSpan] AND highest[pivotSpan](high) < high[pivotSpan] AND high[pivotSpan] > highest[pivotSpan](high)[pivotSpan+1] THEN
   pvH = high[pivotSpan]
   locMaxH = max(high[pivotSpan-1], high[pivotSpan+1])
   sqH = max((pvH - locMaxH) / atr, 0)
   IF sqH >= minSwingAtr THEN
      $zpx[npiv]  = pvH
      $zdir[npiv] = 1
      $zbar[npiv] = barindex - pivotSpan
      $zatr[npiv] = atr
      IF volBase > 0 THEN
         $zvol[npiv] = volume[pivotSpan] / volBase
      ELSE
         $zvol[npiv] = 1.0
      ENDIF
      IF pvH < trendBase THEN
         $ztrend[npiv] = 1.0
      ELSE
         $ztrend[npiv] = 0.0
      ENDIF
      $zswing[npiv] = sqH
      npiv = npiv + 1
   ENDIF
ENDIF


// --- pivot LOW -> support (dir = -1) ---
IF low > low[pivotSpan] AND lowest[pivotSpan](low) > low[pivotSpan] AND low[pivotSpan] < lowest[pivotSpan](low)[pivotSpan+1] THEN
   pvL = low[pivotSpan]
   locMinL = min(low[pivotSpan-1], low[pivotSpan+1])
   sqL = max((locMinL - pvL) / atr, 0)
   IF sqL >= minSwingAtr THEN
      $zpx[npiv]  = pvL
      $zdir[npiv] = -1
      $zbar[npiv] = barindex - pivotSpan
      $zatr[npiv] = atr
      IF volBase > 0 THEN
         $zvol[npiv] = volume[pivotSpan] / volBase
      ELSE
         $zvol[npiv] = 1.0
      ENDIF
      IF pvL > trendBase THEN
         $ztrend[npiv] = 1.0
      ELSE
         $ztrend[npiv] = 0.0
      ENDIF
      $zswing[npiv] = sqL
      npiv = npiv + 1
   ENDIF
ENDIF


// ===== Heavy processing + drawing: only on the last bar =====
IF islastbarupdate THEN


   // --- 1) Collect recent (non-expired) pivots into working arrays ---
   nw = 0
   IF npiv > 0 THEN
      FOR p = npiv - 1 DOWNTO 0 DO
         ageP = barindex - $zbar[p]
         IF ageP <= maxLife AND nw < storedLimit THEN
            half = zoneAtrWidth * $zatr[p] * 0.5
            $wtop[nw]   = $zpx[p] + half
            $wbot[nw]   = $zpx[p] - half
            $wmid[nw]   = $zpx[p]
            $wdir[nw]   = $zdir[p]
            $wbar[nw]   = $zbar[p]
            $wvol[nw]   = $zvol[p]
            $wtrend[nw] = $ztrend[p]
            $wswing[nw] = $zswing[p]
            $walive[nw] = 1
            nw = nw + 1
         ENDIF
      NEXT
   ENDIF


   // --- 2) Absorb overlapping same-side zones ---
   IF nw > 1 THEN
      FOR a = 0 TO nw - 2 DO
         IF $walive[a] = 1 THEN
            FOR b = a + 1 TO nw - 1 DO
               IF $walive[b] = 1 THEN
                  IF $wdir[b] = $wdir[a] THEN
                     ovTop = min($wtop[a], $wtop[b])
                     ovBot = max($wbot[a], $wbot[b])
                     ov = max(ovTop - ovBot, 0)
                     wA = max($wtop[a] - $wbot[a], pipsize)
                     wB = max($wtop[b] - $wbot[b], pipsize)
                     smaller = min(wA, wB)
                     closeMid = abs($wmid[a] - $wmid[b]) <= absorbAtr * atr
                     bigOv = ov / smaller >= 0.35
                     IF closeMid OR bigOv THEN
                        $wtop[a] = max($wtop[a], $wtop[b])
                        $wbot[a] = min($wbot[a], $wbot[b])
                        $wmid[a] = ($wtop[a] + $wbot[a]) / 2
                        IF $wbar[b] < $wbar[a] THEN
                           $wbar[a] = $wbar[b]
                        ENDIF
                        $wvol[a]   = max($wvol[a], $wvol[b])
                        $wtrend[a] = max($wtrend[a], $wtrend[b])
                        $wswing[a] = max($wswing[a], $wswing[b])
                        $walive[b] = 0
                     ENDIF
                  ENDIF
               ENDIF
            NEXT
         ENDIF
      NEXT
   ENDIF


   // --- 3) Per-zone history pass (mitigation, touches, broken) + score + strengths ---
   nz = 0
   IF nw > 0 THEN
      FOR z = 0 TO nw - 1 DO
         IF $walive[z] = 1 THEN
            zTop = $wtop[z]
            zBot = $wbot[z]
            zMid = $wmid[z]
            zDir = $wdir[z]
            zWidth = max(zTop - zBot, pipsize)
            zAge = barindex - $wbar[z]
            breakBuf = breakAtr * atr
            touches = 0.0
            mitig = 0.0
            broke = 0
            life = zAge
            IF life > maxLife THEN
               life = maxLife
            ENDIF
            FOR j = 0 TO life - 1 DO
               hiJ = high[j]
               loJ = low[j]
               clJ = close[j]
               IF hiJ >= zBot AND loJ <= zTop THEN
                  touches = touches + 0.20
                  IF zDir = -1 THEN
                     fillD = zTop - loJ
                  ELSE
                     fillD = hiJ - zBot
                  ENDIF
                  fillR = fillD / zWidth
                  IF fillR < 0 THEN
                     fillR = 0
                  ENDIF
                  IF fillR > 1 THEN
                     fillR = 1
                  ENDIF
                  IF fillR > mitig THEN
                     mitig = fillR
                  ENDIF
               ENDIF
               IF zDir = -1 AND clJ < zBot - breakBuf THEN
                  broke = 1
               ENDIF
               IF zDir = 1 AND clJ > zTop + breakBuf THEN
                  broke = 1
               ENDIF
            NEXT


            IF broke = 0 THEN
               // ----- score (6 factors, same weights as the original) -----
               sizeNorm  = min(zWidth / atr, 1.0)
               volNorm   = min($wvol[z] / 2.0, 1.0)
               swingNorm = min($wswing[z] / 1.5, 1.0)
               touchNorm = min(touches / 4.0, 1.0)
               ageNorm   = min(zAge / 450, 1.0)
               rawScore = sizeNorm*20.0 + volNorm*18.0 + $wtrend[z]*12.0 + swingNorm*28.0 + touchNorm*16.0 + 10.0
               penalty = mitig*22.0 + ageNorm*10.0
               sc = rawScore - penalty
               IF sc > 100 THEN
                  sc = 100
               ENDIF
               IF sc < 0 THEN
                  sc = 0
               ENDIF
               // ----- strengths (bull% / bear% with the original's non-linear tiers) -----
               IF sc >= 75 THEN
                  zoneSide = 72 + (sc - 75) * 1.12
               ELSIF sc >= 45 THEN
                  zoneSide = 48 + (sc - 45) * 0.75
               ELSE
                  zoneSide = sc * 1.05
               ENDIF
               zoneSide = zoneSide + $wtrend[z]*6.0
               zoneSide = zoneSide - mitig*28.0
               IF zoneSide > 100 THEN
                  zoneSide = 100
               ENDIF
               IF zoneSide < 0 THEN
                  zoneSide = 0
               ENDIF
               oppSide = 5.0 + mitig*65.0 + sc*0.08
               IF oppSide > 100 THEN
                  oppSide = 100
               ENDIF
               IF zDir = -1 THEN
                  bullS = zoneSide
                  bearS = oppSide
               ELSE
                  bullS = oppSide
                  bearS = zoneSide
               ENDIF
               // ----- store final zone -----
               $ftop[nz]   = zTop
               $fbot[nz]   = zBot
               $fmid[nz]   = zMid
               $fdir[nz]   = zDir
               $fbar[nz]   = $wbar[z]
               $fscore[nz] = sc
               $fbull[nz]  = bullS
               $fbear[nz]  = bearS
               $fmitig[nz] = mitig
               nz = nz + 1
            ENDIF
         ENDIF
      NEXT
   ENDIF


   // --- 4) Bubble sort final zones by score (descending) ---
   IF nz > 1 THEN
      FOR i = 0 TO nz - 2 DO
         FOR k = 0 TO nz - i - 2 DO
            IF $fscore[k] < $fscore[k+1] THEN
               t1 = $ftop[k]
               $ftop[k] = $ftop[k+1]
               $ftop[k+1] = t1
               t2 = $fbot[k]
               $fbot[k] = $fbot[k+1]
               $fbot[k+1] = t2
               t3 = $fmid[k]
               $fmid[k] = $fmid[k+1]
               $fmid[k+1] = t3
               t4 = $fdir[k]
               $fdir[k] = $fdir[k+1]
               $fdir[k+1] = t4
               t5 = $fbar[k]
               $fbar[k] = $fbar[k+1]
               $fbar[k+1] = t5
               t6 = $fscore[k]
               $fscore[k] = $fscore[k+1]
               $fscore[k+1] = t6
               t7 = $fbull[k]
               $fbull[k] = $fbull[k+1]
               $fbull[k+1] = t7
               t8 = $fbear[k]
               $fbear[k] = $fbear[k+1]
               $fbear[k+1] = t8
               t9 = $fmitig[k]
               $fmitig[k] = $fmitig[k+1]
               $fmitig[k+1] = t9
            ENDIF
         NEXT
      NEXT
   ENDIF


   // --- 5) Draw the top-K visible zones ---
   rightX = barindex + 25
   shown = 0
   IF nz > 0 THEN
      FOR z = 0 TO nz - 1 DO
         passDir = 0
         IF dirFilter = 0 THEN
            passDir = 1
         ENDIF
         IF dirFilter = 1 AND $fdir[z] = -1 THEN
            passDir = 1
         ENDIF
         IF dirFilter = 2 AND $fdir[z] = 1 THEN
            passDir = 1
         ENDIF
         IF passDir = 1 AND shown < visibleLimit THEN
            shown = shown + 1
            IF $fdir[z] = -1 THEN
               cr = supR
               cg = supG
               cb = supB
            ELSE
               cr = resR
               cg = resG
               cb = resB
            ENDIF
            leftX = $fbar[z]
            zTop = $ftop[z]
            zBot = $fbot[z]
            zMid = ($ftop[z] + $fbot[z]) / 2
            // zone body
            DRAWRECTANGLE(leftX, zTop, rightX, zBot) COLOURED(cr, cg, cb, 150) FILLCOLOR(cr, cg, cb, 40)
            // internal strength bars
            IF showBars = 1 THEN
               bullPct = round($fbull[z])
               bearPct = round($fbear[z])
               maxW = (rightX - leftX) * 0.82
               bearW = round(maxW * bearPct / 100)
               bullW = round(maxW * bullPct / 100)
               // bear bar: upper half (top..mid)
               DRAWRECTANGLE(leftX, zTop, leftX + bearW, zMid) COLOURED(resR, resG, resB, 0) FILLCOLOR(resR, resG, resB, 210)
               // bull bar: lower half (mid..bot)
               DRAWRECTANGLE(leftX, zMid, leftX + bullW, zBot) COLOURED(supR, supG, supB, 0) FILLCOLOR(supR, supG, supB, 210)
               DRAWTEXT("#bearPct#%", leftX + bearW / 2, (zTop + zMid) / 2) COLOURED(255, 255, 255)
               DRAWTEXT("#bullPct#%", leftX + bullW / 2, (zMid + zBot) / 2) COLOURED(255, 255, 255)
            ENDIF
            // zone label text (Strong / Weak / Mitigated)
            IF showText = 1 THEN
               IF $fdir[z] = -1 THEN
                  IF $fmitig[z] >= 0.75 THEN
                     DRAWTEXT("Mitigated Support", rightX, zMid) COLOURED(cr, cg, cb)
                  ELSIF $fbull[z] >= 70 THEN
                     DRAWTEXT("Strong Support", rightX, zMid) COLOURED(cr, cg, cb)
                  ELSIF $fbull[z] >= 45 THEN
                     DRAWTEXT("Support", rightX, zMid) COLOURED(cr, cg, cb)
                  ELSE
                     DRAWTEXT("Weak Support", rightX, zMid) COLOURED(cr, cg, cb)
                  ENDIF
               ELSE
                  IF $fmitig[z] >= 0.75 THEN
                     DRAWTEXT("Mitigated Resistance", rightX, zMid) COLOURED(cr, cg, cb)
                  ELSIF $fbear[z] >= 70 THEN
                     DRAWTEXT("Strong Resistance", rightX, zMid) COLOURED(cr, cg, cb)
                  ELSIF $fbear[z] >= 45 THEN
                     DRAWTEXT("Resistance", rightX, zMid) COLOURED(cr, cg, cb)
                  ELSE
                     DRAWTEXT("Weak Resistance", rightX, zMid) COLOURED(cr, cg, cb)
                  ENDIF
               ENDIF
            ENDIF
         ENDIF
      NEXT
   ENDIF
ENDIF


RETURN
