

Range Detector Indicator
Discovering Market Ranges with the Range Detector Indicator
The ability to accurately identify market ranges can provide a significant advantage when trading. Whether for strategies that benefit from market volatility or those that capitalize on periods of consolidation, understanding when and how these ranges form is crucial. The “Range Detector” emerges as an essential tool specifically designed to highlight these critical periods in a visual and accessible manner.
How the Range Detector Works
The mechanics behind the “Range Detector” are based on a clever combination of standard technical indicators and specific mathematical calculations. It uses the Average True Range (ATR), a well-established indicator that measures market volatility, along with a moving average of the closing price, to identify and visually mark price ranges on a chart.
The heart of the indicator lies in its ability to calculate the difference between the current closing price and a moving average, comparing it afterward with the ATR adjusted by a multiplicative factor. This approach allows the “Range Detector” to outline boxes that enclose periods where the price consolidates within a range defined by these parameters. When the closing price deviates significantly beyond the adjusted ATR, it is interpreted as a range expansion, triggering a change in the visual representation of the indicator.
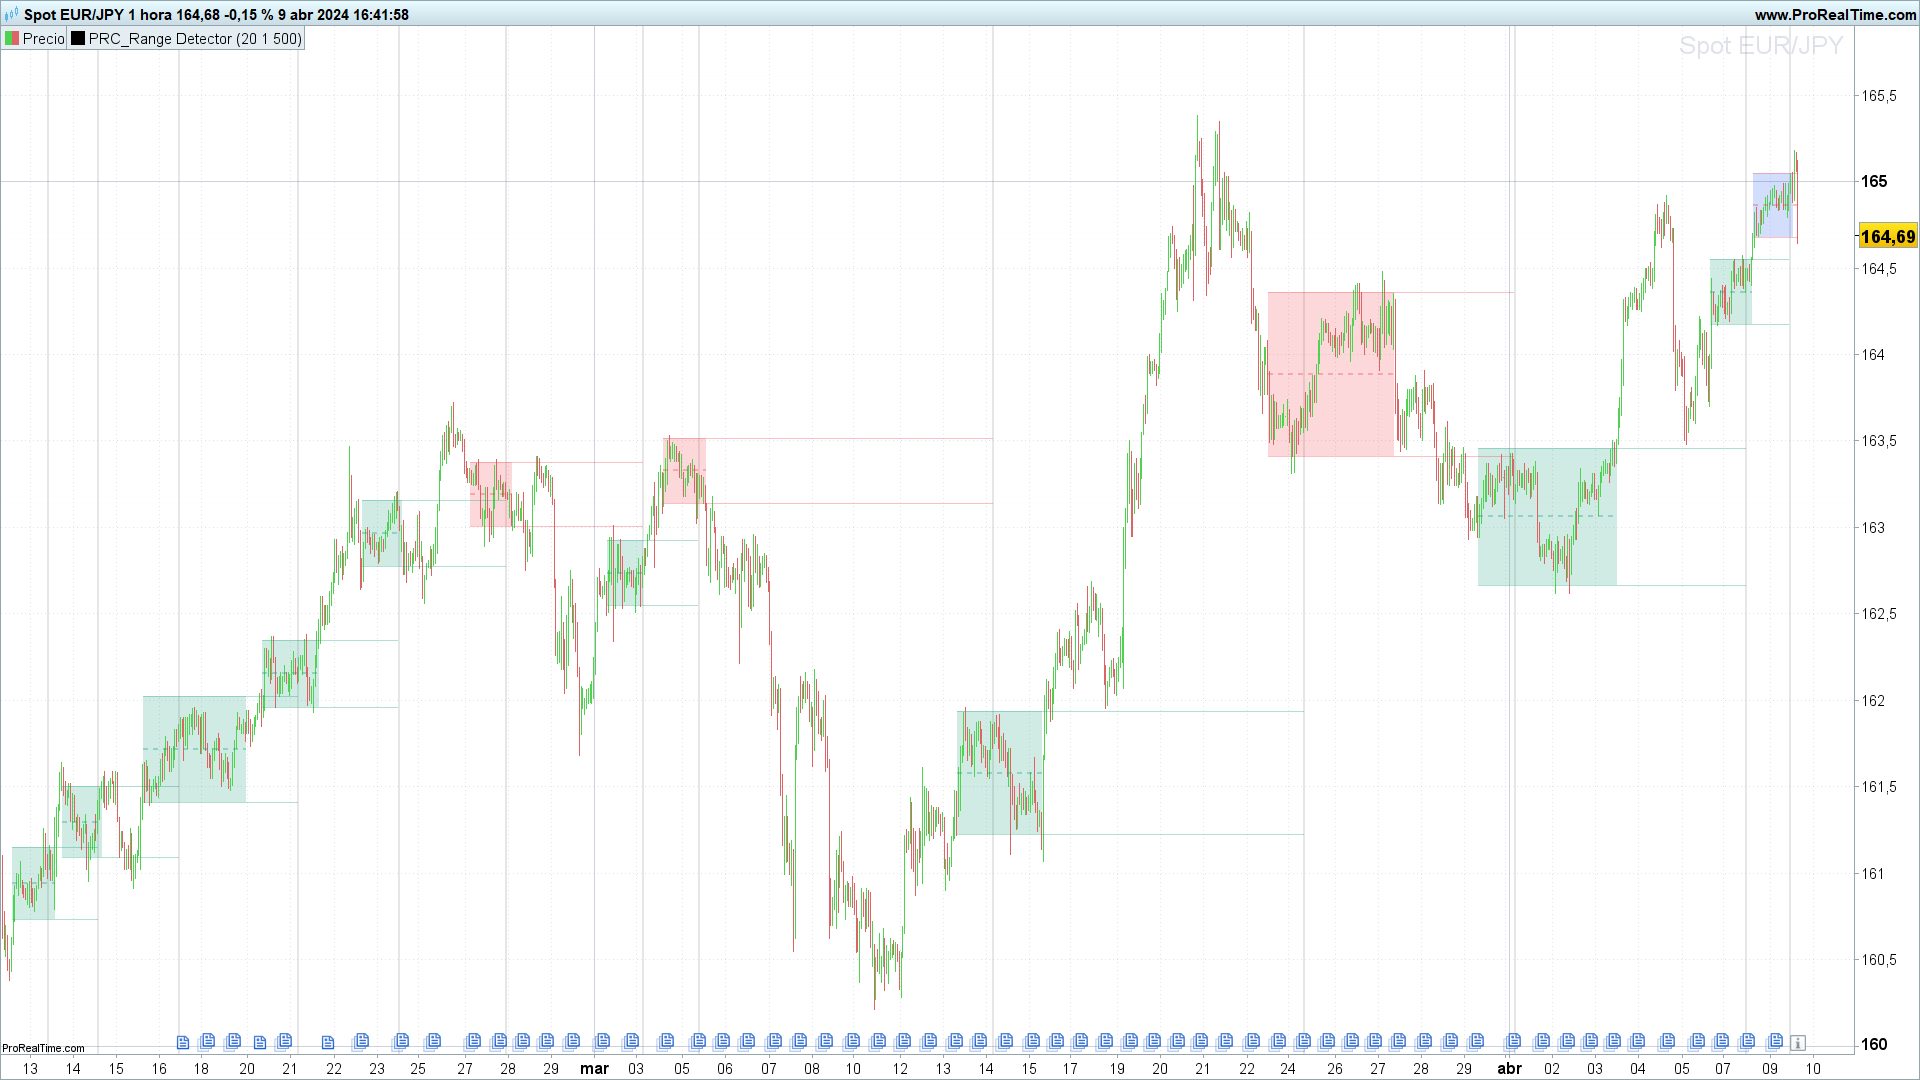
Through this method, the “Range Detector” not only signals the presence of a consolidation range but also provides visual cues about price expansion, which may be a precursor to a significant market movement. The use of colors in the boxes drawn by the indicator offers a quick and clear interpretation: a box of a specific color can indicate consolidation, while a change to another color signals an expansion or range breakout.
Indicator Parameters
A distinctive feature of the “Range Detector” is its flexibility, granted by the possibility to adjust its parameters. This allows traders to adapt the indicator to different markets and trading styles. The adjustable parameters include:
length: Defines the minimum range length to detect. This parameter determines the number of bars used to calculate the moving average, allowing the trader to focus on longer or shorter duration ranges according to their strategy.
mult: Adjusts the width of the boxes in relation to the ATR, modifying the indicator’s sensitivity to market volatility. A larger multiplier expands the range needed for an expansion to be considered, while a smaller value makes it more sensitive to small movements.
atrLen: Determines the length of the ATR used for volatility calculation. This parameter directly influences how the indicator perceives volatility and, therefore, how it identifies consolidation ranges.
These parameters can be adjusted to refine range detection and improve the indicator’s congruence with current market conditions or the employed trading strategy.
Interpreting the Indicator
Interpreting the signals generated by the “Range Detector” is intuitive, offering a clear visualization of market consolidation and expansion periods.
Consolidation boxes: When the price remains within a range defined by the adjusted ATR, the indicator draws a box around this period. The presence of a box suggests that the market is in consolidation, which can be an indication of accumulation or distribution before a significant movement.
Color change in the boxes: A change in the color of the boxes indicates a transition from consolidation to range expansion or vice versa. This change can signal the start of a new trend or the breakout of a range, offering an opportunity to adjust positions or seek entries.
The “Range Detector” is particularly useful for identifying those critical moments where the market is about to make a decisive move, allowing traders to anticipate and react to possible breakouts or trend reversals.
Practical Applications of the Range Detector
The “Range Detector” is not only a technical analysis tool for identifying consolidation and expansion ranges but also provides a solid foundation upon which effective trading strategies can be built. Here are some practical applications.
Breakout trading:
By identifying a consolidation period using the indicator’s boxes, traders can prepare to enter a position at the moment of the breakout. An expansion of the range, indicated by the color change in the boxes, may signal the optimal moment to execute a trade.
Trading within the range:
In addition to preparing for breakouts, the “Range Detector” also offers the opportunity to trade the rebounds within a consolidated range. When the price touches one of the edges of the consolidation box, traders may consider opening a position in the direction of the opposite edge of the range, anticipating a possible turn.
Risk management:
The “Range Detector” can help set more precise stop-loss levels, placing them just outside the consolidation box. This reduces the likelihood of being prematurely stopped out in volatile markets.
Entry optimization:
Traders can use the indicator to fine-tune their entry points, waiting for a confirmation of consolidation or expansion before committing to a position.
These are just some of the multiple ways in which the “Range Detector” can enrich any trader’s toolbox, offering a clear and reasoned perspective for making more informed trading decisions.
Indicator Code in ProBuilder
The “Range Detector” indicator is based on the analysis of market volatility and the detection of consolidation ranges. Below is the basic code outline in ProBuilder, ready to be customized and implemented in ProRealTime:
//------------------------------------------------------------------------//
//PRC_Range Detector
//version = 0
//09.04.24
//Iván González @ www.prorealcode.com
//Sharing ProRealTime knowledge
//------------------------------------------------------------------------//
defparam drawonlastbaronly=true
//-----Inputs-------------------------------------------------------------//
length=20//Minimum Range Length
mult=1//Range Width
atrLen=500//ATR Length
//------------------------------------------------------------------------//
//-----Moving average and ATR definition----------------------------------//
n=barindex
atr=averagetruerange[atrlen](close)*mult
ma=average[length,0](close)
//-----Check range--------------------------------------------------------//
count=0
for j=0 to length-1 do
if abs(close[j]-ma) > atr then
count=count+1
else
count=count
endif
next
//-----Box definition-----------------------------------------------------//
if count=0 and count[1]<>count then
//Test for overlap and change coordinates
if n[length] <= $boxright[x] then
maxi = max(ma+atr,$boxtop[x])
mini = min(ma-atr,$boxbot[x])
//Box new coordinates
$boxtop[x]=maxi
$boxbot[x]=mini
$boxright[x]=n
//Line new coordinates
avg=(maxi+mini)/2
$levely1[x]=avg
$levelx2[x]=n
$levely2[x]=avg
//backgroundcolor("Blue",50)
else
maxi=ma+atr
mini=ma-atr
//Set new box
$boxtop[x+1]=maxi
$boxbot[x+1]=mini
$boxright[x+1]=n
$boxleft[x+1]=n[length]
//Set new level
$levely1[x+1]=ma
$levelx2[x+1]=n
$levely2[x+1]=ma
$levelx1[x+1]=n[length]
//Set color
$rbox[x+1]=33
$gbox[x+1]=87
$bbox[x+1]=243
//Highligth first occurrence
backgroundcolor("grey",50)
$start[x+1]=n
//Set new value for x
x=x+1
endif
elsif count=0 then
//Extend the box
$boxright[x]=n
$levelx2[x]=n
endif
//------------------------------------------------------------------------//
//-----Color Boxes--------------------------------------------------------//
if close > $boxtop[x] then
$rbox[x]=8
$gbox[x]=153
$bbox[x]=119
elsif close < $boxbot[x] then
$rbox[x]=242
$gbox[x]=54
$bbox[x]=69
endif
//------------------------------------------------------------------------//
//-----Draw previous Boxes and Levels-------------------------------------//
for i=0 to x-1 do
drawrectangle($boxleft[i],$boxbot[i],$boxright[i],$boxtop[i])fillcolor($rbox[i],$gbox[i],$bbox[i],50)coloured($rbox[i],$gbox[i],$bbox[i],0)
//-----Medium Levels---------------------------------------------------//
drawsegment($levelx1[i],$levely1[i],$levelx2[i],$levely2[i])coloured($rbox[i],$gbox[i],$bbox[i],80)style(dottedline,2)
//-----Top and Bottom Levels-------------------------------------------//
drawsegment($levelx1[i],$boxbot[i],$start[i+1],$boxbot[i])coloured($rbox[i],$gbox[i],$bbox[i],80)
drawsegment($levelx1[i],$boxtop[i],$start[i+1],$boxtop[i])coloured($rbox[i],$gbox[i],$bbox[i],80)
next
//------------------------------------------------------------------------//
//-----Color last Box----------------------------------------------------//
if close > $boxtop[x] then
r=8
g=153
b=119
elsif close < $boxbot[x] then
r=242
g=54
b=69
else
r=33
g=87
b=243
endif
//------------------------------------------------------------------------//
//-----Draw last Box and Levels-------------------------------------------//
drawrectangle($boxleft[x],$boxbot[x],$boxright[x],$boxtop[x])fillcolor(r,g,b,50)coloured(r,g,b,0)
//-----Medium Levels---------------------------------------------------//
drawsegment($levelx1[x],$levely1[x],barindex,$levely2[x])coloured($rbox[x],$gbox[x],$bbox[x],80)style(dottedline,2)
//-----Top and Bottom Levels----------------------------------------------//
drawsegment($levelx1[x],$boxbot[x],barindex,$boxbot[x])coloured($rbox[x],$gbox[x],$bbox[x],80)
drawsegment($levelx1[x],$boxtop[x],barindex,$boxtop[x])coloured($rbox[x],$gbox[x],$bbox[x],80)
//------------------------------------------------------------------------//
return
This code is a basis upon which adjustments can be made, such as modifying the parameters length, mult, and atrLen to suit different strategies and trading preferences.
Conclusion
The “Range Detector” indicator represents a powerful and versatile technical analysis tool, capable of providing significant insights into market dynamics. By integrating it into their trading strategy, traders can better leverage market opportunities, manage risk more effectively, and make trading decisions with greater confidence. Its flexibility and the visual clarity it offers make it a very interesting complement.
