

Range Coefficient
Version:
1.0, (April 2017)
Author:
Maz @ prorealcode.com
Description:
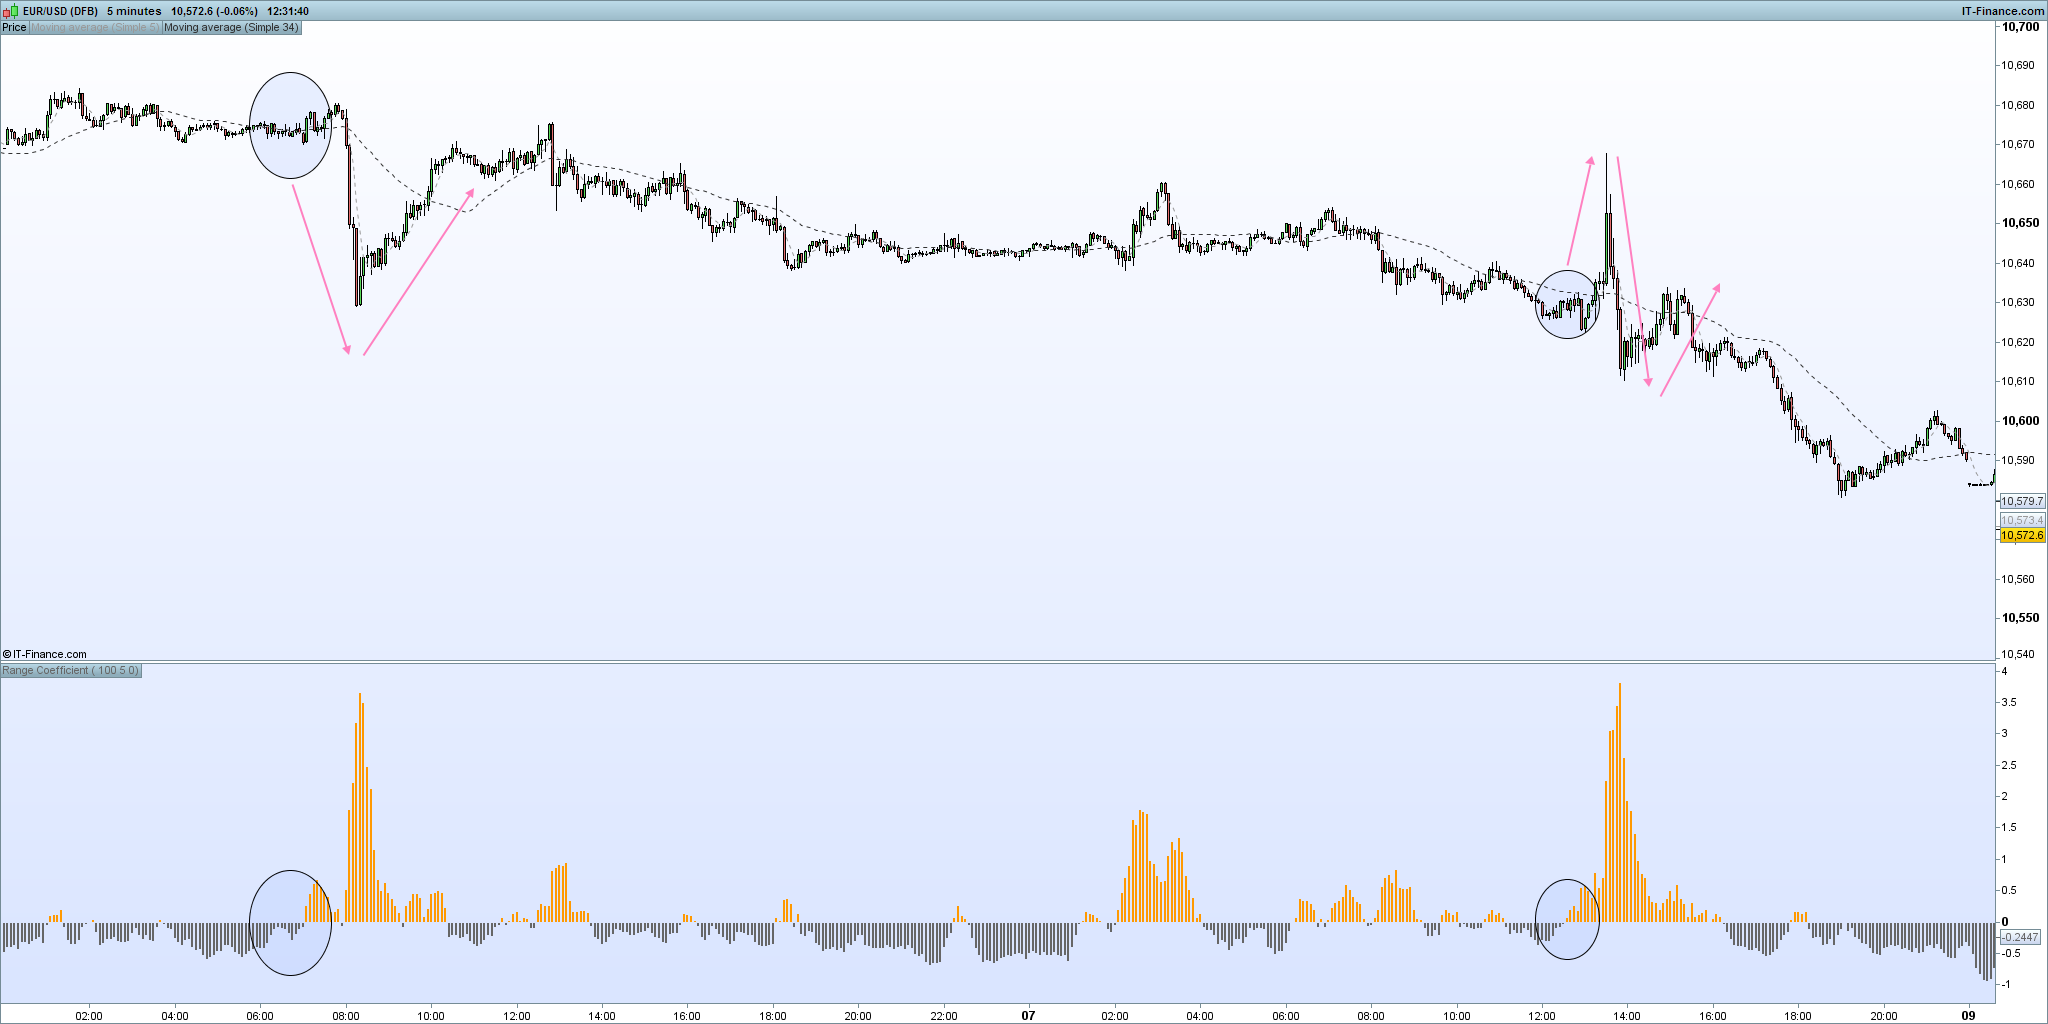
Histogram showing coefficient of recent range (or recent average range) against longer term average range.
This indicator can be used to predict volatility
Interpretation:
Values at or below zero show the recent candle range is less than or equal to the average candle range;
Values above zero show the recent candle range is increasing against the average candle range;
An upward trending range coefficient crossing above the zero line suggests that volatility is consistently increasing and that higher volatility is to follow;
A downward trending range coefficient below the zero line suggests that the volatility is decreasing.
In addition, look for the difference in market moves between high range coefficient and low range coefficient
— code —
// =========================================================== \\
// Range Coefficient
// ----------------------------------------------------------- //
// Version:
// 1.0, April 2017
// Author:
// Maz @ prorealcode.com | Contact: prtmaz at gmail dot com
// ----------------------------------------------------------- //

//settings
// longPeriod = 100
// shortPeriod = 5
// maType = 1
//end of settings

longPeriod  = max(1, longPeriod)
shortPeriod = max(1, shortPeriod)
r  = abs(range)
xr = (average[shortPeriod, maType](r) / average[longPeriod,  maType](r))  - 1
// xr = max(0, xr) // hide values below zero

return xr style(histogram, 1) as "Range Coefficient"