

Range Action Verification Index (RAVI) - extended
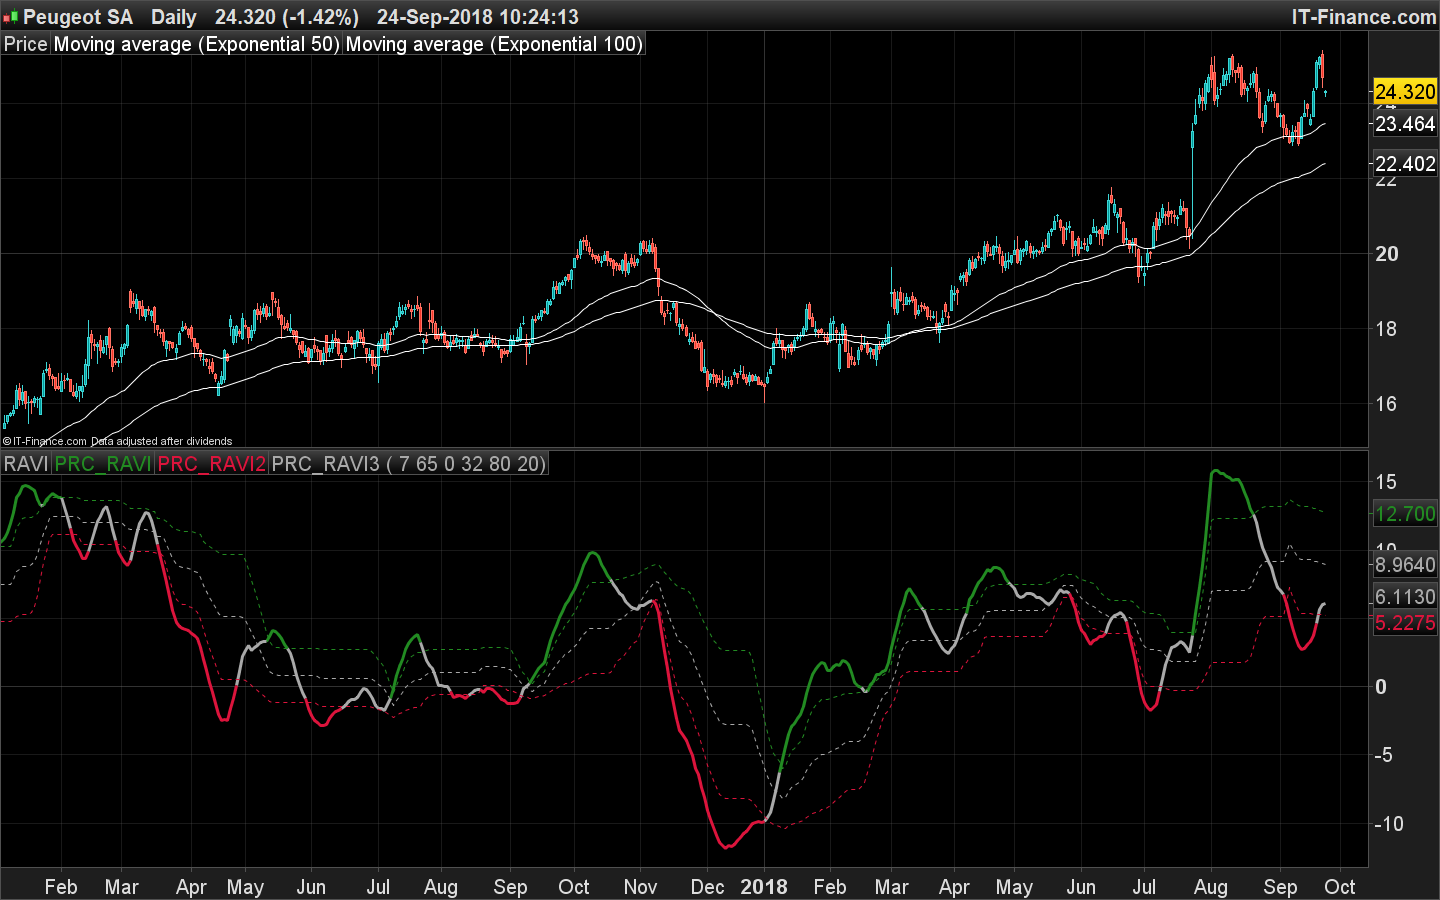
Developed by Tushar Chande, the Range Action Verification Index (RAVI) is used in order to help identify if the market is in a trend. The indicator shows the difference (in percentage) between the current prices and the past prices. Two key lines are recommended by Chande for the RAVI – 3% or 1% in dependence on the market.
A bull trend begins, when the RAVI crosses the 3% key line from bottom-up. The bull trend is considered as active as long as the indicator line moves up.
A bear trend begins, when the RAVI crosses the 1% key line from top to the downside. The bear trend is considered as active as long as the indicator line moves down.
This version embed the floating levels percentage to help determine short term reversal or earlier trend change signals. You can also modify the moving average type used in the oscillator calculation (default is Simple Moving Average).
//PRC_RAVI (Range Action Verification Index) | indicator
//24.09.2018
//Nicolas @ www.prorealcode.com
//Sharing ProRealTime knowledge
//converted from MT5 version

// --- settings
FastPeriod  =  7          // Fast period
SlowPeriod  = 65          // Slow period
MAtype = 0                   // Moving average type (1= exponential)
inpFlPeriod    = 32          // Floating levels period
inpFlLevelUp   = 80.0        // Up level %
inpFlLevelDown = 20.0        // Down level %
// --- end of settings

inpPrice       = customclose

maFast = average[FastPeriod,MAtype](inpPrice)
maSlow = average[SlowPeriod,MAtype](inpPrice)

val = 100 * (maFast-maSlow)/maSlow
imin = lowest[inpFlPeriod](val)
imax = highest[inpFlPeriod](val)
rrange = imax-imin
flup = imin+inpFlLevelUp  *rrange/100.0
fldn = imin+inpFlLevelDown*rrange/100.0
flmi = imin+50            *rrange/100.0

r=169
g=169
b=169
if val>flup then
 r=34
 g=139
 b=34
elsif val<fldn then
 r=220
 g=20
 b=60
endif

return val coloured(r,g,b) style(line,3) as "RAVI", flup coloured(34,139,34) style(dottedline), fldn coloured(220,20,60) style(dottedline), flmi coloured(169,169,169) style(dottedline)