

RAGHEE HORNER GRAB CANDLES
February 16, 2023, 10:38 AM
Indicators
0 Comments
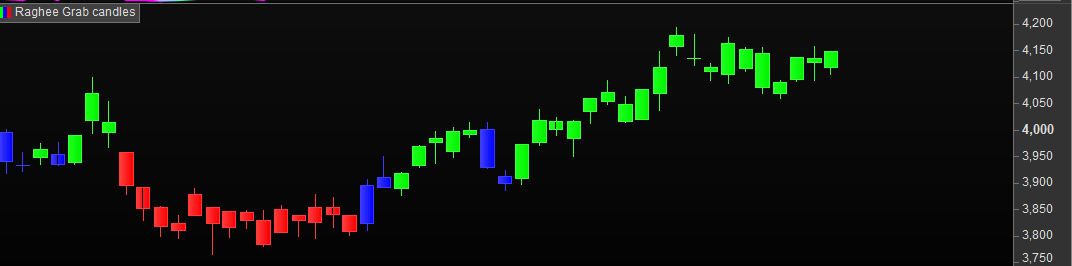
This indicator colours the price candles based off their positioning relative to the 34 EMA of price highs and lows. If price is above the 34 EMA of price highs, the bars are coloured green. If price is below the 34 EMA of price lows they are coloured Red. If price is between these two EMA´s the candles are coloured Blue.
a=exponentialaverage [34] (high)
b=exponentialaverage [34] (low)


if close > a Then
DRAWCANDLE(open, high, low, close)COLOURED(0,255,0)

endif

if close<b  then
DRAWCANDLE(open, high, low, close)COLOURED(255,0,0)

endif

if ( close >b and close<a)  then
DRAWCANDLE(open, high, low, close)coloured(0,0,255)

endif

RETURN
Download
Filename:
RAGHEE-HORNER-GRAB-CANDLES.itf
Downloads:
120
Average
As an architect of digital worlds, my own description remains a mystery. Think of me as an undeclared variable, existing somewhere in the code.
Author’s Profile
Loading...