

R-Squared correlation coefficient - R²
September 19, 2018, 1:44 PM
Indicators
0 Comments
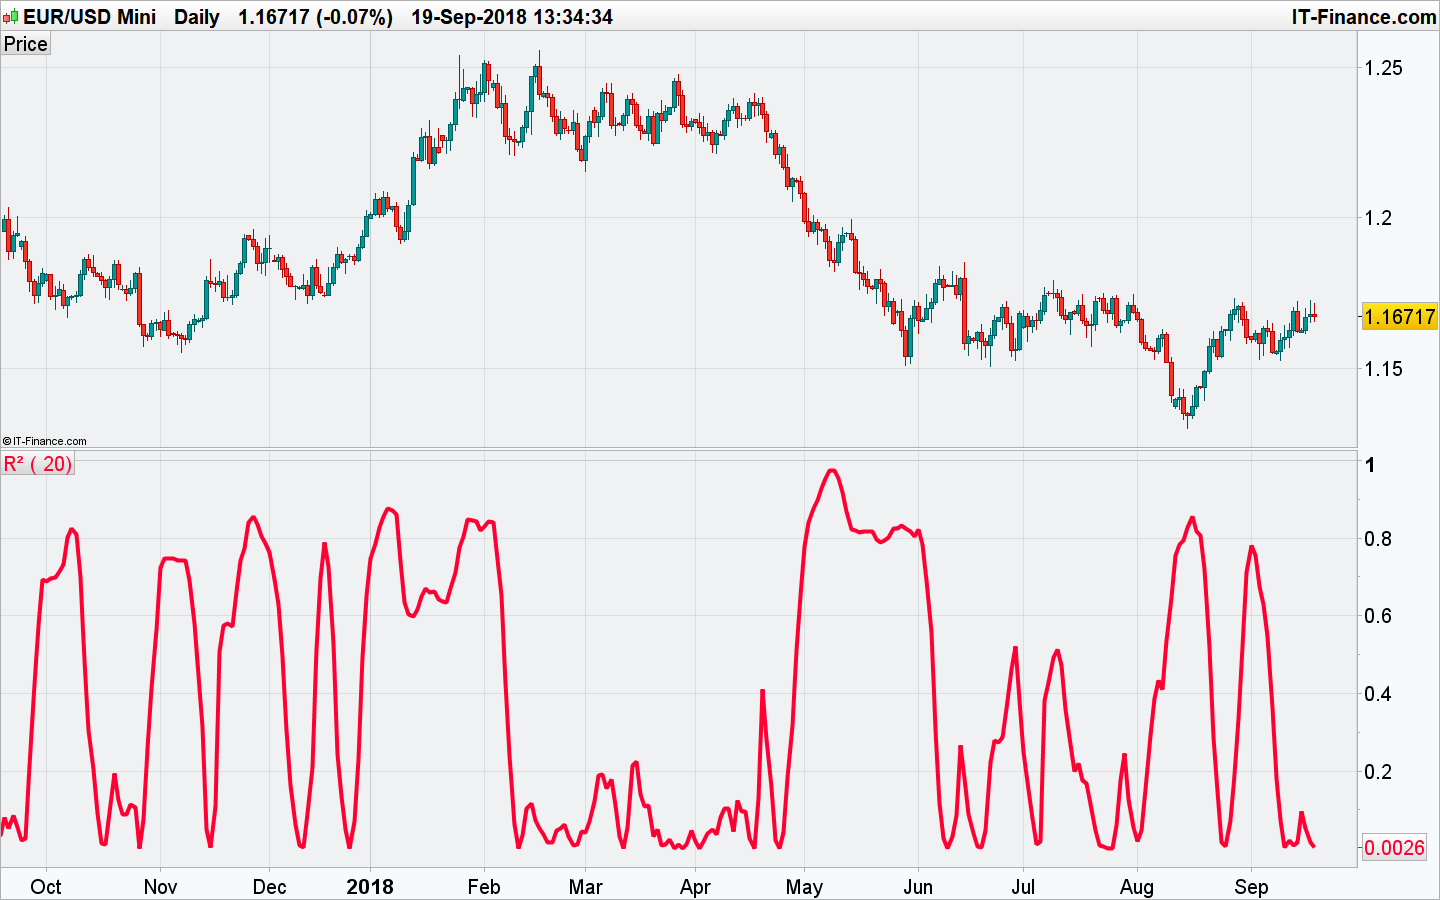
In statistics, the coefficient of determination, denoted R2 or r2 and pronounced “R squared”, is the proportion of the variance in the dependent variable that is predictable from the independent variable(s) (wikipedia).
The R-squared indicator gives a correlation coefficient between 0 to 1 (0 = no correlation , 1 = highly correlated) by comparing the injected data to a straight linear regression line.
This indicator gives the same values as the R2 instruction. Some asked me the code to study the embedded instruction of the platform, here it is.
//PRC_R-Squared coefficient | indicator
//19.09.2018
//Nicolas @ www.prorealcode.com
//Sharing ProRealTime knowledge

// --- settings
period = 20
// --- end of settings

Data = customclose

SumX  = 0
SumXX = 0
SumXY = 0
SumYY = 0
SumY  = 0

if barindex>Period then

 for k=0 to period-1 do
  tprice = Data[k]
  SumX  = SumX+(k+1)
  SumXX = SumXX+((k+1)*(k+1))
  SumXY = SumXY+((k+1)*tprice)
  SumYY = SumYY+(tprice*tprice)
  SumY  = SumY+tprice
 next

 Q1  = SumXY - SumX*SumY/period
 Q2  = SumXX - SumX*SumX/period
 Q3  = SumYY - SumY*SumY/period

 iRsq=((Q1*Q1)/(Q2*Q3))

endif

return iRsq as "R²"
Download
Filename:
PRC_R-Squared-coefficient.itf
Downloads:
132
Master
I created ProRealCode because I believe in the power of shared knowledge. I spend my time coding new tools and helping members solve complex problems.
If you are stuck on a code or need a fresh perspective on a strategy, I am always willing to help. Welcome to the community!
Author’s Profile
Loading...