

R-squared adaptive Exponential Moving Average
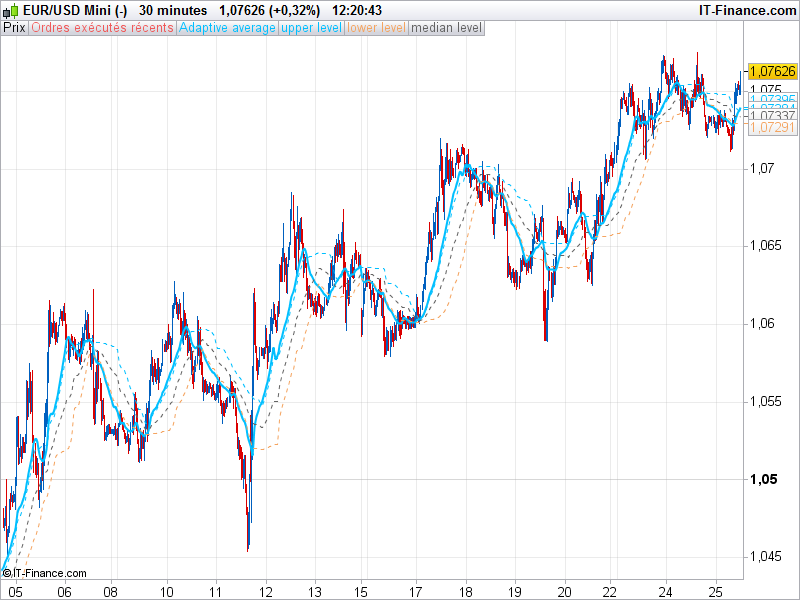
The R-squared adaptive EMA indicator is made of different curves drawn on price chart. The main concept behind this new moving average is the capability to adapt its period thanks to the comparison made with the coefficient of determination / average of the least squares with an exponential moving average.
The adaptive formula will tend to make the MA the more precise to the current price direction from the last X “Period”.
Another great idea of this indicator is to draw “floating levels” above or below the EMA which are calculated with percentage of the highest and lowest values of the EMA within the last Y “flLookBack” periods.
The adaptive function code of this indicator can be use in many other indicators and new original concept, I suppose I’ll post more of them into the library in the future days/weeks.
The original idea came from forex-tsd forum, author: mladen.
//PRC_r-squared adaptive Exponential Moving Average | indicator
//25.01.2017
//Nicolas @ www.prorealcode.com
//Sharing ProRealTime knowledge

//--- parameters
// Period = 20
// flLookBack = 25 // Floating levels lookback period
// flLevelUp = 90 // Floating levels up level %
// flLevelDown = 10 // Floating levels down level %
//---

Data = customclose

SumX  = 0
SumXX = 0
SumXY = 0
SumYY = 0
SumY  = 0

if barindex>Period then

 // adaptive r-squared periods
 for k=0 to period-1 do
  tprice = Data[k]
  SumX  = SumX+(k+1)
  SumXX = SumXX+((k+1)*(k+1))
  SumXY = SumXY+((k+1)*tprice)
  SumYY = SumYY+(tprice*tprice)
  SumY  = SumY+tprice
 next

 Q1  = SumXY - SumX*SumY/period
 Q2  = SumXX - SumX*SumX/period
 Q3  = SumYY - SumY*SumY/period

 iRsq=((Q1*Q1)/(Q2*Q3))
 //returned moving average
 avg = exponentialaverage[Period+Period*(iRsq-0.25)](Data)

 //floating levels
 mini   = lowest[flLookBack](avg)
 maxi   = highest[flLookBack](avg)
 rrange = maxi-mini
 flu    = mini+flLevelUp*rrange/100.0
 fld    = mini+flLevelDown*rrange/100.0
 flm    = mini+0.5*rrange

endif

RETURN avg coloured(0,191,255) STYLE(line,2) as "Adaptive average", flu coloured(0,191,255) STYLE(dottedline,1) as "upper level", fld coloured(244,164,96) STYLE(dottedline,1) as "lower level", flm coloured(100,100,100) STYLE(dottedline,1) as "median level"