

Quino Statistics Plotter
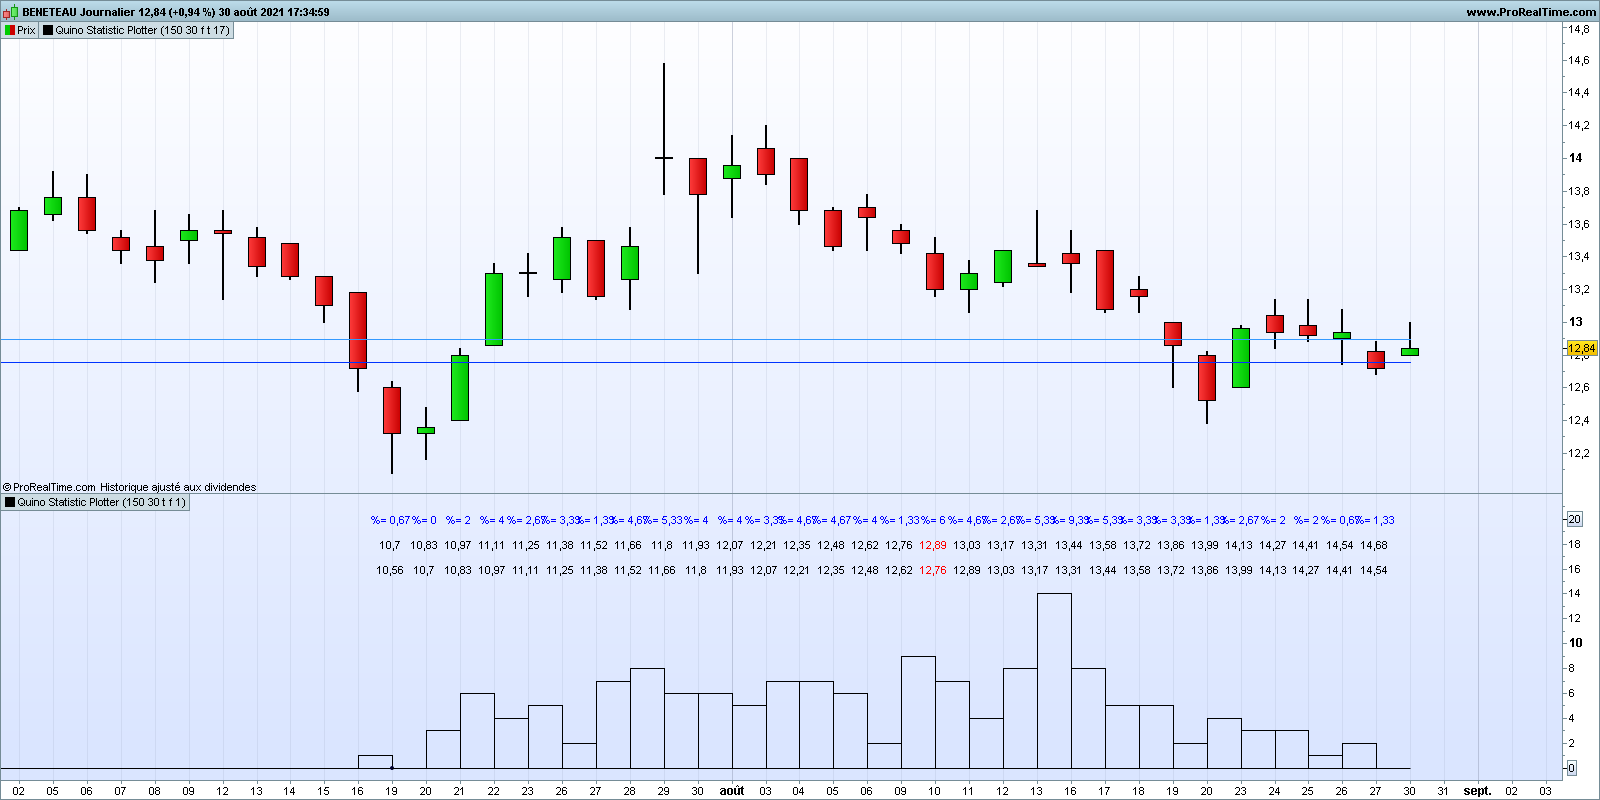
This indicator, in the stand-alone option, allows you to build a histogram for a given number of bars, representing the distribution of “Close” values that are grouped together in class. Each class of the same dimension corresponds to an interval in which the values of the “Close” are stored. The amplitude of the classes is defined by the user (5 possible samples by class is a quite good choice)
By inserting this indicator in the price chart, it is possible to draw two parallel lines corresponding to the upper and lower bounds of a selected class.
It can be useful to:
– check if the distribution has the form of a Gaussian curve for those who want to calculate a statistic according to the formulas of the normal distribution
– identify profit objectives and risk of losses based on statistical analysis
– identify areas of resistance, support, range based on statistical analysis
– ……….
// Quino Statistics Plotter
// By Quino
// 26/08/2021
//===================================================================================
// NbrOfSamples : Number of consecutive close
// NbrOfClasses : Number of intervals of values in which we store the values of "close
// InformationDisplay :
// - false : display of the curve only
// - true : display of limit values for each class and % of occurrence
// ClassTracer :
// - false : indicator that can be used stand-alone (curve and information)
// - true : indicator usable in the price indicator. By locating the class of the last "close" or another class. Class boundaries are represented by two horizontal lines on the price chart.
// ClassIndex : manual search for the class number corresponding to the last "close" or another class. Alignment of the cue point under the value of the last close (in red)
//Typical use : NbrOfSamples=150 ; NbrOfClasses=30
//===================================================================================
//----------------------------------
if islastbarupdate then
for k =0 to NbrOfSamples-1 do
$v[k]=close[k]
next
for i= NbrOfSamples-1 downto 0 do
$d[i]=arraymax($v)
for j=NbrOfSamples-1 downto 0 do
if $v[j]=$d[i] then
$v[j]=0
break
endif
next
next
Bin=(arraymax($d)-arraymin($d))/(NbrOfClasses)
For i=0 to NbrOfClasses do
$R[i]=0
next
BinA=arraymin($d)
for j=0 to NbrOfClasses do
Dtemp=0
for i=0 to NbrOfSamples-1 do
if j < NbrOfClasses then
if $d[i]>=BinA+ j*Bin and $d[i] <BinA+(j+1)*Bin then
Dtemp=Dtemp+1
else
if $d[i]>=BinA+ j*Bin and $d[i] =<BinA+(j+1)*Bin then
Dtemp=Dtemp+1
endif
endif
endif
next
$r[j]=Dtemp
next
for i= 0 to NbrOfClasses-1 do
if ClassTracer then
ValCaseMax=(BinA+ClassIndex*Bin)
ValCaseMin=(BinA+(ClassIndex-1)*Bin)
drawsegment(barindex[NbrOfSamples-1-i],ValCaseMax,barindex[NbrOfClasses-i-1],ValCaseMax)coloured (51,153,255)
drawsegment(barindex[NbrOfSamples-1-i],ValCaseMin,barindex[NbrOfClasses-i-1],ValCaseMin)coloured (0,51,1530)
if i=ClassIndex then
tag=1
else
tag=undefined
endif
else
drawsegment(barindex[NbrOfClasses-i],$r[i],barindex[NbrOfClasses-i],0)coloured (0,0,0)
drawsegment(barindex[NbrOfClasses-i],$r[i],barindex[NbrOfClasses-i+1],$r[i])coloured (0,0,0)
drawsegment(barindex[NbrOfClasses-i+1],0,barindex[NbrOfClasses-i+1],$r[i]) coloured (0,0,0)
drawpoint(barindex[NbrOfClasses-ClassIndex+1],tag)coloured (0,0,50)
if InformationDisplay then
Scale=arraymax($r)
for i= 0 to NbrOfClasses-1 do
temp=round(($r[i]/(NbrOfSamples))*10000)/100
temp1=round((BinA+(i-0)*Bin),2)
temp2=round((BinA+(i+1)*Bin),2)
drawtext("%= #temp#",barindex[NbrOfClasses-i],Scale+6)coloured (0,0,255)
if close >= temp1 and close < temp2 then
drawtext("#temp1#",barindex[NbrOfClasses-i],Scale+2)coloured (255,0,0)
drawtext("#temp2#",barindex[NbrOfClasses-i],Scale+4)coloured (255,0,0)
else
drawtext("#temp1#",barindex[NbrOfClasses-i],Scale+2)coloured (0,0,0)
drawtext("#temp2#",barindex[NbrOfClasses-i],Scale+4)coloured (0,0,0)
endif
next
endif
endif
next
endif
Scale=arraymax($r)+6
if not ClassTracer then
zero=0
else
zero=undefined
Scale=undefined
endif
return Scale as "Vertical Reference",zero as "Zéro"