

Protected Highs & Lows
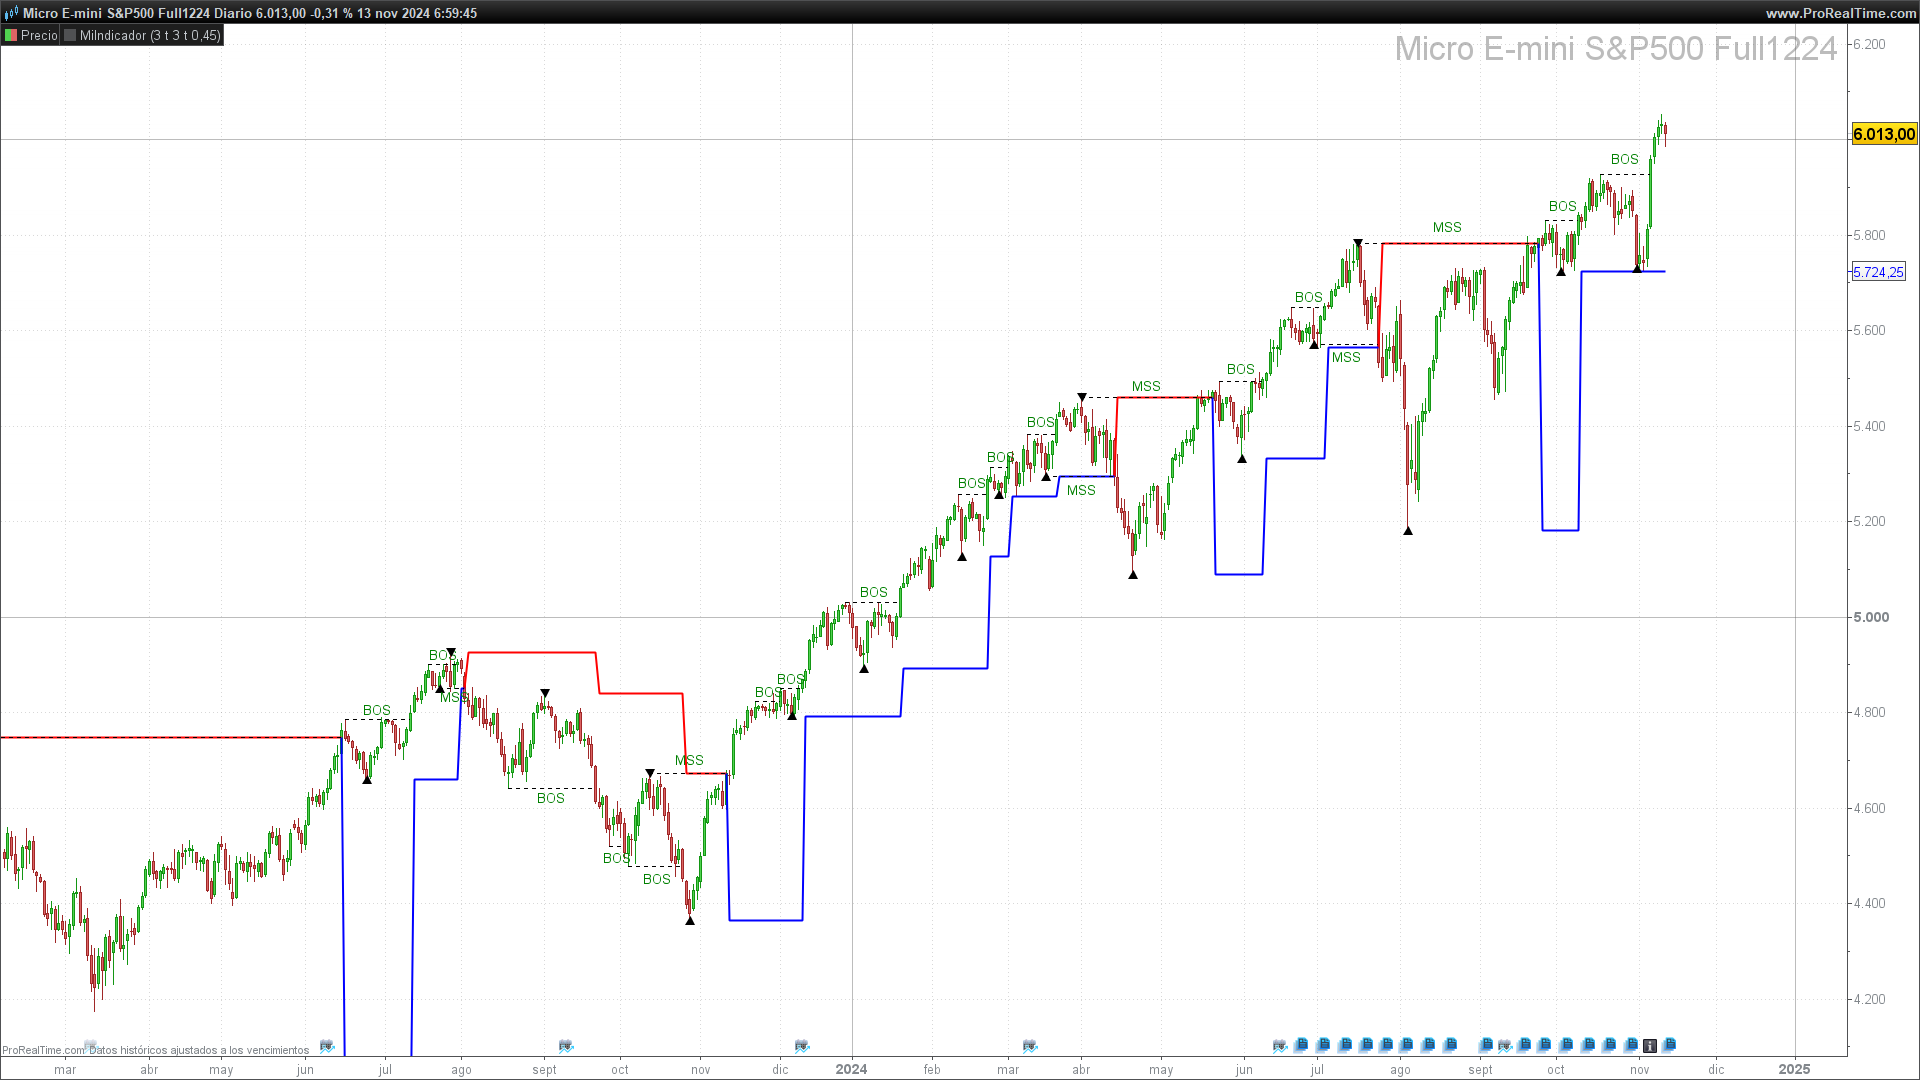
The Protected Highs & Lows indicator is an advanced tool that helps traders identify critical support and resistance points on a chart. These levels are based on the identification of high and low pivots that meet specific confirmation criteria. Through these pivots, the indicator signals potential changes in price direction and helps validate breakouts or structural changes in the market, known as “BOS” (Break of Structure) and “MSS” (Market Structure Shift).
This indicator is especially useful in trading stocks, forex, and futures, where accurately identifying support and resistance can improve decision-making by providing clarity in volatile markets.
How the Indicator Works
The functionality of the indicator is based on detecting protected high and low pivots. These pivot points are determined by using a combination of the high and low price levels and the Average True Range (ATR) to establish the confirmation distance.
- Pivot Detection: The indicator examines recent prices to find conditions that qualify a point as a high or low pivot. To do this, it evaluates whether the current price exceeds certain levels and meets high or low conditions within a defined period.
- Protected Level Confirmation: Once a pivot has been identified, the indicator assesses whether the price has held or surpassed that level, turning it into a protected level. These points are highlighted on the chart and serve as critical support or resistance zones.
- BOS and MSS Labels: At confirmed pivot points, the indicator can display “BOS” or “MSS” labels based on the structural change. These terms help interpret whether the price is breaking an existing structure or shifting market structure.
Configuration Parameters
The indicator offers a range of customizable settings to adjust its behavior based on user preferences or specific analysis needs. Here are some key parameters:
- ps (Analysis Period): Defines the number of bars the indicator uses to determine whether the price meets the pivot conditions. Higher values make the indicator more conservative in detecting pivots.
- ATR (Average True Range): The ATR is a key component in calculating the confirmation distances for pivots. By default, the ATR period is set to 14 bars, though it can be adjusted to fit different time frames or volatilities.
- Coefficient (coef): This parameter adjusts the sensitivity of the confirmation level relative to the ATR. A higher coefficient increases the protective distance for pivots, while a lower value decreases this distance, showing more pivot points.
- Labels (showLabels and labelType): Users can decide whether to display labels at pivots and, if so, choose the label type: only market structure shifts (MSS), breakouts of structure (BOS), or both.
- Show Protected Highs & Lows (showphl): Activates or deactivates the display of ▲ and ▼ symbols indicating the presence of protected highs and lows on the chart.
Implementation and ProBuilder Code
Below is the ProBuilder code for the Protected Highs & Lows indicator.
//-----------------------------------------------------------//
//PRC_Protected Highs & Lows
//version = 0
//18.06.24
//Iván González @ www.prorealcode.com
//Sharing ProRealTime knowledge
//-----------------------------------------------------------//
//-----Inputs------------------------------------------------//
ps = 1
src1 = low
src2 = high
showLabels=1
labelType=3 //1=MSS 2=BOS 3=All
showphl=1
atr=averagetruerange[14](close)
coef=0.45
//-----------------------------------------------------------//
once lastlow=0
once lastlowidx=0
once lasthigh=0
once lasthighidx=0
once trackhigh=0
once trackhighidx=0
once tracklow=0
once tracklowidx=0
//-----------------------------------------------------------//
//-----Pivots low--------------------------------------------//
if src1 > src1[ps] and lowest[ps](src1) > src1[ps] and src1[ps] < lowest[ps](src1)[ps+1] and not isset($pl[0]) then
$pivotl[t+1]=src1[ps]
t=t+1

$pl[0]=src1[ps]
$plx[0] = barindex[ps]

pPricelow=high[ps]
pIdx=barindex[ps]
pBull=0
pValidlow=0

if lastlow=0 then
lastlow = low[ps]
lastlowidx = barindex[ps]
else
if low[ps] < lastlow then
lastlow = low[ps]
lastlowidx = barindex[ps]
endif
endif

//drawpoint(barindex[ps],src1[ps],2)coloured("blue",150)

endif
//-----------------------------------------------------------//
//-----Pivots high-------------------------------------------//
if src2 < src2[ps] and highest[ps](src2)<src2[ps] and src2[ps]>highest[ps](src2)[ps+1] and not isset($ph[0]) then

$pivoth[z+1]=src2[ps]
z=z+1

$ph[0]=src2[ps]
$phx[0] = barindex[ps]

pPricehigh=low[ps]
pIdx=barindex
pBull=1
pValidhigh=0

if lasthigh=0 then
lasthigh = high[ps]
lasthighidx = barindex[ps]
else
if high[ps] > lasthigh then
lasthigh = high[ps]
lasthighidx = barindex[ps]
endif
endif

//drawpoint(barindex[ps],src2[ps],2)coloured("red",150)
endif
//-----------------------------------------------------------//
if pBull then
if close<pPricehigh and pValidhigh=0 then
pValidhigh=1
endif
else
if close>pPricehigh and pValidhigh=0 then
pValidhigh=1
endif
endif

if pBull then
if close<pPricelow and pValidlow=0 then
pValidlow=1
endif
else
if close>pPricelow and pValidlow=0 then
pValidlow=1
endif
endif
//-----------------------------------------------------------//
if (high[ps]>trackHigh or trackhigh=0 or lastlowidx>=trackHighidx) and isset($ph[0]) and pValidlow then
trackhigh=high[ps]
trackhighidx=barindex[ps]
endif

if (low[ps]<tracklow or tracklow=0 or lasthighidx>=tracklowidx) and isset($pl[0]) and pValidhigh then
tracklow=low[ps]
tracklowidx=barindex[ps]
endif
//-----------------------------------------------------------//
bosbear=0
bosbull=0
mssbear=0
mssbull=0
change=0

if isset($ph[0]) then
if close > $ph[0] then
if showLabels then
if labelType=1 and not bull then
drawtext("MSS",(barindex+$phx[0])/2,$ph[0]+coef*atr)coloured("green")
drawsegment(barindex,$ph[0],$phx[0],$ph[0])style(dottedline)
elsif labelType=2 and bull then
drawtext("BOS",(barindex+$phx[0])/2,$ph[0]+coef*atr)coloured("green")
drawsegment(barindex,$ph[0],$phx[0],$ph[0])style(dottedline)
elsif labelType=3 and not bull then
drawtext("MSS",(barindex+$phx[0])/2,$ph[0]+coef*atr)coloured("green")
drawsegment(barindex,$ph[0],$phx[0],$ph[0])style(dottedline)
elsif labelType=3 and bull then
drawtext("BOS",(barindex+$phx[0])/2,$ph[0]+coef*atr)coloured("green")
drawsegment(barindex,$ph[0],$phx[0],$ph[0])style(dottedline)
endif
endif

if bull then
bosbull=1
else
mssbull=1
endif

bull=1
change=1

unset($ph)
unset($phx)
unset($pl)
unset($plx)

if tracklow>0 then
if showphl then
drawtext("▲",barindex[barindex-tracklowidx],tracklow)
endif
$pl[0]=tracklow
$plx[0]=barindex[barindex-tracklowidx]
lasthigh=0
endif
endif
endif

if isset($pl[0]) then
if close < $pl[0] then

if showLabels then
if labelType=1 and bull then
drawtext("MSS",(barindex+$plx[0])/2,$pl[0]-coef*atr)coloured("green")
drawsegment(barindex,$pl[0],$plx[0],$pl[0])style(dottedline)
elsif labelType=2 and not bull then
drawtext("BOS",(barindex+$plx[0])/2,$pl[0]-coef*atr)coloured("green")
drawsegment(barindex,$pl[0],$plx[0],$pl[0])style(dottedline)
elsif labelType=3 and not bull then
drawtext("BOS",(barindex+$plx[0])/2,$pl[0]-coef*atr)coloured("green")
drawsegment(barindex,$pl[0],$plx[0],$pl[0])style(dottedline)
elsif labelType=3 and bull then
drawtext("MSS",(barindex+$plx[0])/2,$pl[0]-coef*atr)coloured("green")
drawsegment(barindex,$pl[0],$plx[0],$pl[0])style(dottedline)
endif
endif

if not bull then
bosbear=1
else
mssbear=1
endif

bull=0
change=1

unset($ph)
unset($phx)
unset($pl)
unset($plx)

if trackhigh>0 then
if showphl then
drawtext("▼",barindex[barindex-trackhighidx],trackhigh)
endif
$ph[0]=trackhigh
$phx[0]=barindex[barindex-trackhighidx]
lastlow=0
endif
endif
endif
//-----------------------------------------------------------//
if change[1] then
if bosbear[1] or mssbear[1] then
trailprice=trackhigh
r=255
b=0
elsif bosbull[1] or mssbull[1] then
trailprice=tracklow
r=0
b=255
endif
endif
//-----------------------------------------------------------//
return trailprice coloured(r,0,b)style(line,2)
