

Progressive Session Candles
This indicator is a further development of the ‘Session Candles Only’ indicator that can be found here:
https://www.prorealcode.com/prorealtime-indicators/session-candles-only/
Just like that indicator this indicator allows you to only show candles between two selected times.
The space between sessions can be either blank or have a line that goes from close to close. Select the line by ticking or unticking the OOHLine option.
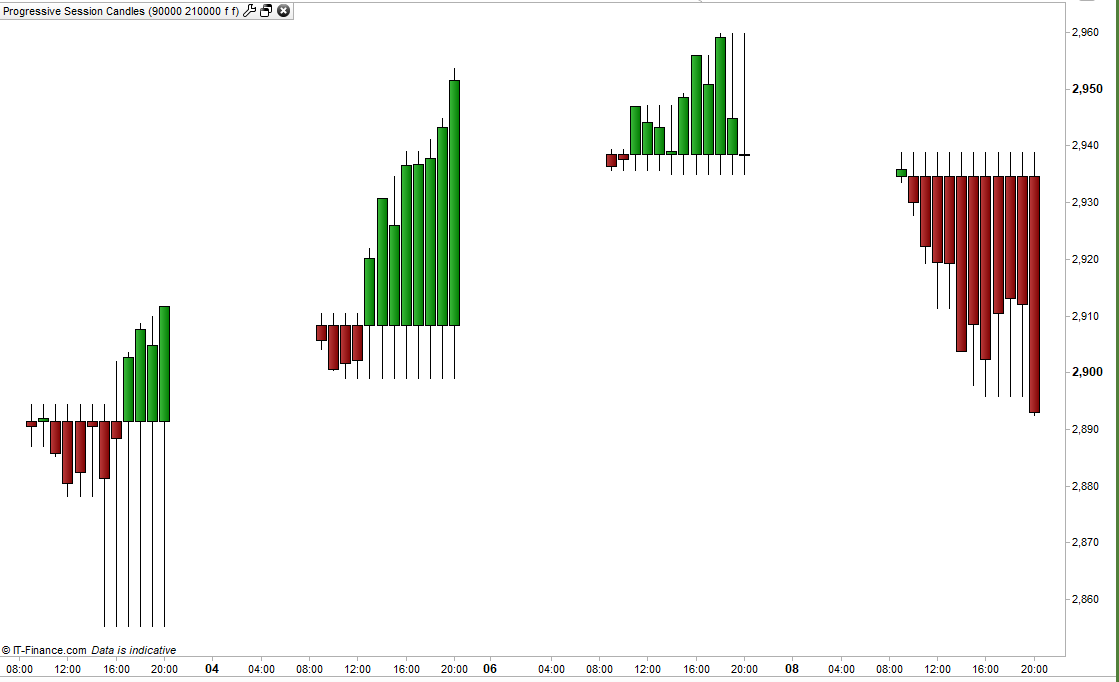
In this version the candles are progressive. This means that each candle shows what a single candle for that session would look like up to that point in time. With these candles we can see how the session is developing as well as how it got to where it is. The open of each candle is the open for the session, the low and high are the lowest low and highest high so far in that session.
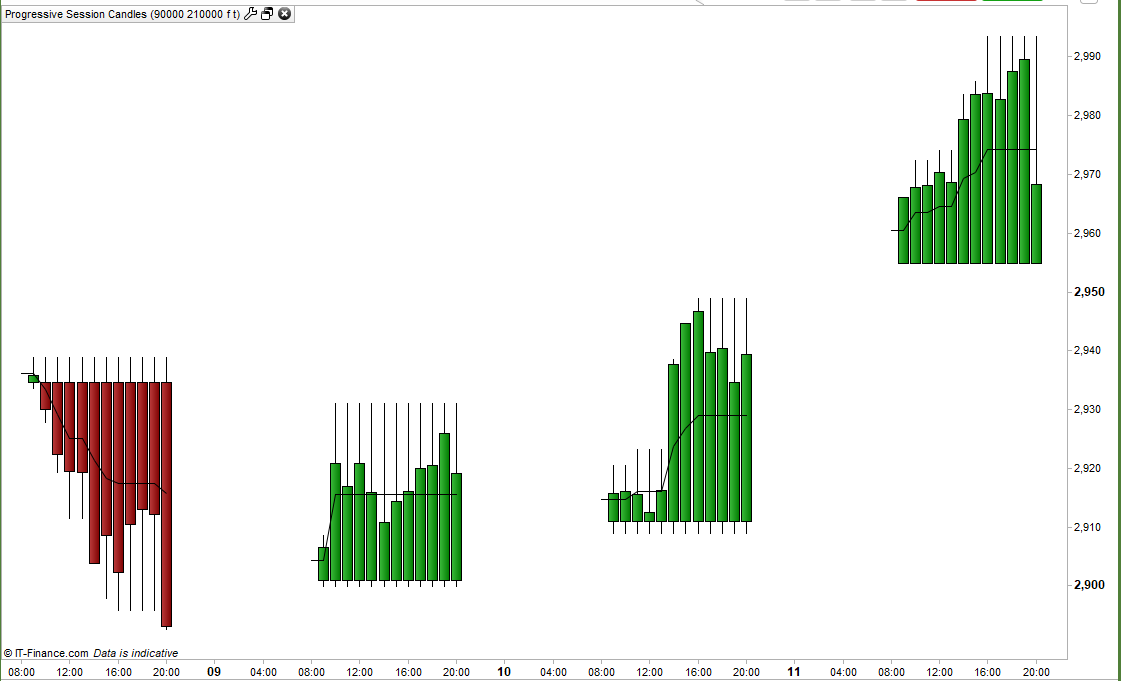
There is also the option to add a median price line for the session. Turn this on or off with the ‘MedPrice’ option.
As usual I advise downloading the ITF file and uploading it to ensure full functionality.
//Progressive Session Candles
//By Vonasi
//20191022

//starttime = 090000
//endtime = 210000

if opentime >= starttime and opentime < endtime then
 if opentime = starttime and oohline then
  drawsegment(barindex,open,barindex-1,close[1]) COLOURED(0,0,0)
 endif

 if opentime = starttime then
  myopen = open
  hh = high
  ll = low
 endif

 hh = max(high,hh)
 ll = min(low,ll)

 if medprice then
  mp = ((hh-ll)/2) + ll
  mp2 = mp[1]
  if opentime = starttime then
   mp2 = mp
  endif
  drawsegment(barindex[1],mp2,barindex,mp)
 endif

 r = 128
 g = 0
 if close > myopen then
  r = 0
  g = 128
 endif

 drawcandle(myopen,hh,ll,close) COLOURED(R,G,0) BORDERCOLOR(0,0,0)
else
 if oohline then
  drawsegment(barindex,close,barindex-1,close[1]) COLOURED(0,0,0)
 endif
endif

return