

Price Action Tools
Price Action Tools
This program is primarily intended for investors trading primarily with price action using the minimum for better efficiency.
Without the use of superfluous indicators these simple lines of code allow:
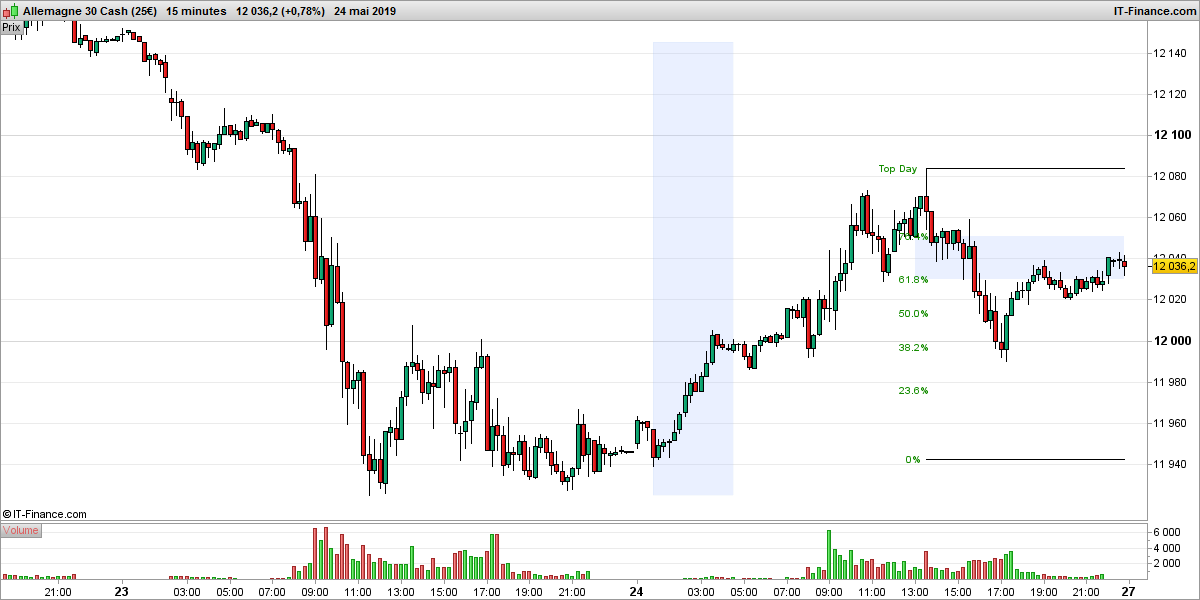
– Automatic detection of Fibonacci levels with correct alignment orientation
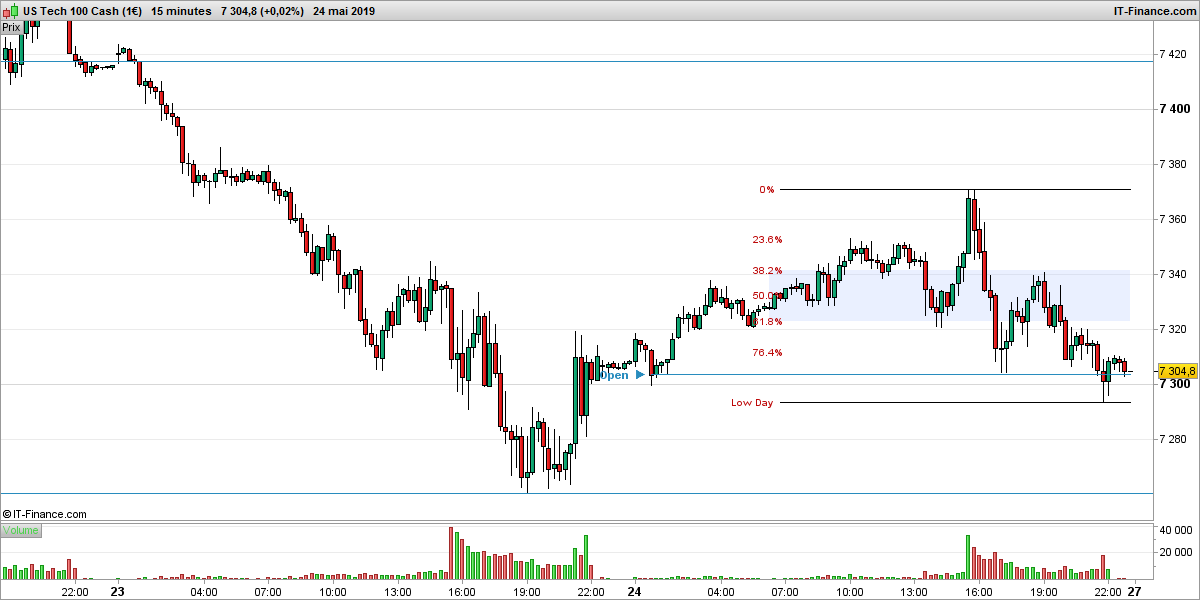
– Visualization of the highest and lowest of the current session or of a previous day selectable form continuous line or a rectangle with partly adjustable width and
– The Opening level of the active session …
In the chapter of the variables it is possible to intervene on the properties allowing
– “Grid” to select a particular “area” that you want to view between two levels of Fibonacci or let the program do it automatically (0)
– “XOffset” to manually set the width of the rectangle covering this selected area
– “Alpha” to adjust the transparency of the text at your convenience
– “SetBar” to act on the width of the rectangle covering the lines “higher and lower”
– “NDay” to select the active session (0) or the previous days (1 yesterday, 2 before yesterday, ect …)
– “HLine” Check visualization lines “up, down” selection by “NDay” or rectangle plus the opening level
For any questions about the program “Price Action Tools” please make your request here ► https://www.prorealcode.com/topic/price-action-tools/
// Price Action Tools | Indicator
// 25.05.2019 (Release 1.0)
// Swapping @ www.forexswap.fr
// Sharing ProRealTime knowledge

DefParam DrawOnLastBarOnly = true

// --- Property settings
Grid    = 0            // Select Area between Fibonacci levels (0 = automatic)
XOffset = 10           // Text XOffset
Alpha   = 12           // Text Transparency
SetBar  = 0            // Width adjustment rectangle
NDay    = 0            // Choice Day (0 = today, 1 = yesterday)
HLine   = 1            // Check (0 = Box, 1 = DrawHLine)
// --- end

// --- init
XOffset = max(2,XOffset)
alpha = max(alpha,0)     // Limited input "Alpha"
alpha = min(alpha,255)   // (0 min, 255 max)
NDay = max(NDay,0)       // Limited input "Day"
NDay = min(NDay,31)      // (0 today, 31 end of month)
// --- end

if day <> day[1] then
startbar = BarIndex
endif

HiDay  = dhigh(NDay)
LowDay = dlow(NDay)

if HLine = 1 then
DrawHline(HiDay)  coloured(40,140,190,255) // Upper Top Line
DrawHline(LowDay) coloured(40,140,190,255) // Lower Low Line
DrawText("Open  ►                   ",startbar,dopen(0),SansSerif,Bold,11) coloured(40,140,190,alpha)
DrawSegment(startbar,dopen(0),barindex,dopen(0)) coloured(40,140,190)
else
DrawRectangle(startbar,HiDay,BarIndex-SetBar,LowDay) coloured(40,140,200,10) // Rectangle
endif

if low > fib50 then                // Bullish sense
fib100 = DHigh(0)               //100%
DrawText("Top Day ",BarIndex-XOffset-3,fib100,SansSerif,Bold,10) coloured(20,140,0,alpha)
DrawSegment(BarIndex[XOffset-2],fib100,BarIndex,fib100) coloured(0,0,0,alpha)
fib76 = (fib100-fib0)*.764+fib0 //76.4%
DrawText("76.4% ",BarIndex-XOffset,fib76,SansSerif,Standard,10) coloured(20,140,0,alpha)
fib62 = (fib100-fib0)*.618+fib0 //61.8%
DrawText("61.8% ",BarIndex-XOffset,fib62,SansSerif,Standard,10) coloured(20,140,0,alpha)
fib50 = (fib100-fib0)/2+fib0    //50%
DrawText("50.0% ",BarIndex-XOffset,fib50,SansSerif,Standard,10) coloured(20,140,0,alpha)
fib38 = (fib100-fib0)*.382+fib0 //38.2%
DrawText("38.2% ",BarIndex-XOffset,fib38,SansSerif,Standard,10) coloured(20,140,0,alpha)
fib24 = (fib100-fib0)*.236+fib0 //23.6%
DrawText("23.6% ",BarIndex-XOffset,fib24,SansSerif,Standard,10) coloured(20,140,0,alpha)
fib0 = DLow(0)                  //0%
DrawText("0% ",BarIndex-XOffset,fib0,SansSerif,Standard,10) coloured(20,140,0,alpha)
DrawSegment(BarIndex[XOffset-2],fib0,BarIndex,fib0) coloured(0,0,0,alpha)
endif

if high < fib50 then               // Bearish sense
fib100 = DHigh(0)               //0%
DrawText("Low Day ",BarIndex-XOffset-3,fib0,SansSerif,Bold,10) coloured(190,10,10,alpha)
DrawSegment(BarIndex[XOffset-2],fib0,BarIndex,fib0) coloured(0,0,0,alpha)
fib76 = (fib100-fib0)*.764+fib0 //23.6%
DrawText("23.6% ",BarIndex-XOffset,fib76,SansSerif,Standard,10) coloured(190,10,10,alpha)
fib62 = (fib100-fib0)*.618+fib0 //38.2%
DrawText("38.2% ",BarIndex-XOffset,fib62,SansSerif,Standard,10) coloured(190,10,10,alpha)
fib50 = (fib100-fib0)*.5+fib0   //50%
DrawText("50.0% ",BarIndex-XOffset,fib50,SansSerif,Standard,10) coloured(190,10,10,alpha)
fib38 = (fib100-fib0)*.382+fib0 //61.8%
DrawText("61.8% ",BarIndex-XOffset,fib38,SansSerif,Standard,10) coloured(190,10,10,alpha)
fib24 = (fib100-fib0)*.236+fib0 //76.4%
DrawText("76.4% ",BarIndex-XOffset,fib24,SansSerif,Standard,10) coloured(190,10,10,alpha)
fib0 = DLow(0)                  //100%
DrawText("0% ",BarIndex-XOffset,fib100,SansSerif,Standard,10) coloured(190,10,10,alpha)
DrawSegment(BarIndex[XOffset-2],fib100,BarIndex,fib100) coloured(0,0,0,alpha)
endif

//-------------------------------------------------
// Check Box Selected Manual Area [1 to 14]
if grid = 1 and low > fib50 then   // area 0-23.6
DrawRectangle(BarIndex-XOffset,fib0,BarIndex[0],fib24) coloured(0,0,0,0)
elsif grid = 1 and low < fib50 then
DrawRectangle(BarIndex-XOffset,fib0,BarIndex[0],fib24) coloured(0,0,0,0)
endif
if grid = 2 and low > fib50 then   // area 23.6-38.2
DrawRectangle(BarIndex-XOffset,fib24,BarIndex[0],fib38) coloured(0,0,0,0)
elsif grid = 2 and low < fib50 then
DrawRectangle(BarIndex-XOffset,fib24,BarIndex[0],fib38) coloured(0,0,0,0)
endif
if grid = 3 and low > fib50 then   // area 38.2-50.0
DrawRectangle(BarIndex-XOffset,fib38,BarIndex[0],fib50) coloured(0,0,0,0)
elsif grid = 3 and low < fib50 then
DrawRectangle(BarIndex-XOffset,fib38,BarIndex[0],fib50) coloured(0,0,0,0)
endif
if grid = 4 and low > fib50 then   // area 50.0-61.8
DrawRectangle(BarIndex-XOffset,fib50,BarIndex[0],fib62) coloured(0,0,0,0)
elsif grid = 4 and low < fib50 then
DrawRectangle(BarIndex-XOffset,fib50,BarIndex[0],fib62) coloured(0,0,0,0)
endif
if grid = 5 and low > fib50 then   // area 61.8-76.4
DrawRectangle(BarIndex-XOffset,fib62,BarIndex[0],fib76) coloured(0,0,0,0)
elsif grid = 5 and low < fib50 then
DrawRectangle(BarIndex-XOffset,fib62,BarIndex[0],fib76) coloured(0,0,0,0)
endif
if grid = 6 and low > fib50 then   // area 76.4-100
DrawRectangle(BarIndex-XOffset,fib76,BarIndex[0],fib100) coloured(0,0,0,0)
elsif grid = 6 and low < fib50 then
DrawRectangle(BarIndex-XOffset,fib76,BarIndex[0],fib100) coloured(0,0,0,0)
endif
if grid = 7 and low > fib50 then   // area 100-61.8
DrawRectangle(BarIndex-XOffset,fib100,BarIndex[0],fib62) coloured(0,0,0,0)
elsif grid = 7 and low < fib50 then
DrawRectangle(BarIndex-XOffset,fib100,BarIndex[0],fib62) coloured(0,0,0,0)
endif
if grid = 8 and low > fib50 then   // area 76.4-50.0
DrawRectangle(BarIndex-XOffset,fib76,BarIndex[0],fib50) coloured(0,0,0,0)
elsif grid = 8 and low < fib50 then
DrawRectangle(BarIndex-XOffset,fib76,BarIndex[0],fib50) coloured(0,0,0,0)
endif
if grid = 9 and low > fib50 then   // area 61.8-38.2
DrawRectangle(BarIndex-XOffset,fib62,BarIndex[0],fib38) coloured(0,0,0,0)
elsif grid = 9 and low < fib50 then
DrawRectangle(BarIndex-XOffset,fib62,BarIndex[0],fib38) coloured(0,0,0,0)
endif
if grid = 10 and low > fib50 then  // area 50.0-23.6
DrawRectangle(BarIndex-XOffset,fib50,BarIndex[0],fib24) coloured(0,0,0,0)
elsif grid = 10 and low < fib50 then
DrawRectangle(BarIndex-XOffset,fib50,BarIndex[0],fib24) coloured(0,0,0,0)
endif
if grid = 11 and low > fib50 then  // area 38.26-0
DrawRectangle(BarIndex-XOffset,fib38,BarIndex[0],fib0) coloured(0,0,0,0)
elsif grid = 11 and low < fib50 then
DrawRectangle(BarIndex-XOffset,fib38,BarIndex[0],fib0) coloured(0,0,0,0)
endif
if grid = 12 and low > fib50 then  // area 50.0-100
DrawRectangle(BarIndex-XOffset,fib50,BarIndex[0],fib100) coloured(0,0,0,0)
elsif grid = 12 and low < fib50 then
DrawRectangle(BarIndex-XOffset,fib50,BarIndex[0],fib100) coloured(0,0,0,0)
endif
if grid = 13 and low > fib50 then  // area 50.0-0
DrawRectangle(BarIndex-XOffset,fib0,BarIndex[0],fib50) coloured(0,0,0,0)
elsif grid = 13 and low < fib50 then
DrawRectangle(BarIndex-XOffset,fib0,BarIndex[0],fib50) coloured(0,0,0,0)
endif
if grid = 14 and low > fib50 then  // area 0-100
DrawRectangle(BarIndex-XOffset,fib0,BarIndex[0],fib100) coloured(0,0,0,0)
elsif grid = 14 and low < fib50 then
DrawRectangle(BarIndex-XOffset,fib0,BarIndex[0],fib100) coloured(0,0,0,0)
endif

//-------------------------------------------------
// Check Box Selected Automatic Area [0] bull/bear
if grid = 0 and low > fib50 and close > fib0 and close < fib24 then   // area 0-23.6
DrawRectangle(BarIndex-XOffset,fib0,BarIndex[0],fib24) coloured(0,0,0,0)
elsif grid = 0 and high < fib50 and close > fib0 and close < fib24 then  // bear
DrawRectangle(BarIndex-XOffset,fib24,BarIndex[0],fib0) coloured(0,0,0,0)
endif
if grid = 0 and low > fib50 and close > fib24 and close < fib38 then  // area 23.6-38.2
DrawRectangle(BarIndex-XOffset,fib24,BarIndex[0],fib38) coloured(0,0,0,0)
elsif grid = 0 and high < fib50 and close > fib24 and close < fib38 then // bear
DrawRectangle(BarIndex-XOffset,fib24,BarIndex[0],fib38) coloured(0,0,0,0)
endif
if grid = 0 and low > fib50 and close > fib38 and close < fib50 then  // area 38.2-50.0
DrawRectangle(BarIndex-XOffset,fib38,BarIndex[0],fib50) coloured(0,0,0,0)
elsif grid = 0 and high < fib50 and close > fib38 and close < fib50 then // bear
DrawRectangle(BarIndex-XOffset,fib38,BarIndex[0],fib50) coloured(0,0,0,0)
endif
if grid = 0 and low > fib50 and close > fib50 and close < fib62 then  // area 50.0-61.8
DrawRectangle(BarIndex-XOffset,fib50,BarIndex[0],fib62) coloured(0,0,0,0)
elsif grid = 0 and high < fib50 and close > fib50 and close < fib62 then // bear
DrawRectangle(BarIndex-XOffset,fib50,BarIndex[0],fib62) coloured(0,0,0,0)
endif
if grid = 0 and low > fib50 and close > fib62 and close < fib76 then  // area 61.8-76.4
DrawRectangle(BarIndex-XOffset,fib62,BarIndex[0],fib76) coloured(0,0,0,0)
elsif grid = 0 and high < fib50 and close > fib76 and close < fib100 then // bear
DrawRectangle(BarIndex-XOffset,fib76,BarIndex[0],fib100) coloured(0,0,0,0)
endif
if grid = 0 and low > fib50 and close > fib76 and close < fib100 then // area 76.4-100
DrawRectangle(BarIndex-XOffset,fib76,BarIndex[0],fib100) coloured(0,0,0,0)
elsif grid = 0 and high < fib50 and close > fib76 and close < fib100 then // bear
DrawRectangle(BarIndex-XOffset,fib76,BarIndex[0],fib100) coloured(0,0,0,0)
endif

return