

Price Action Toolkit Lite
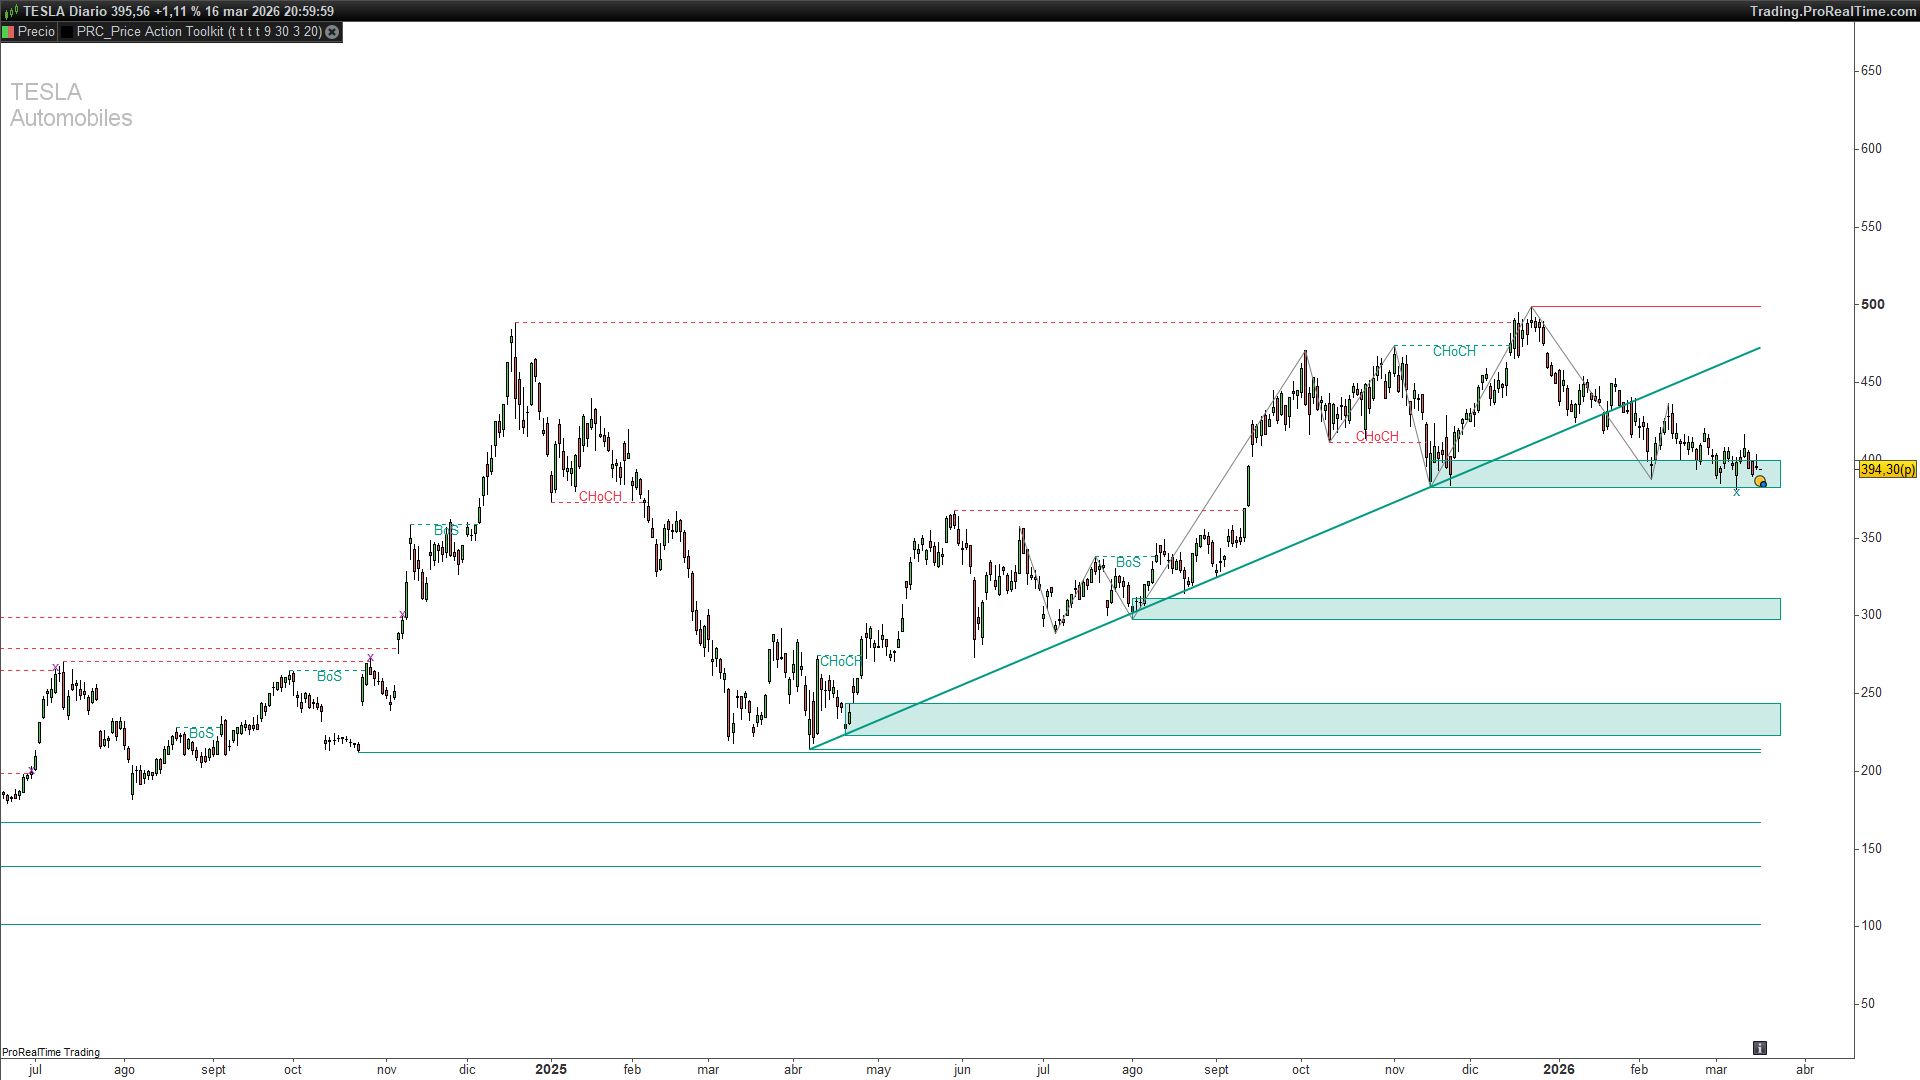
This indicator combines four essential Price Action analysis modules into a single overlay: Market Structure, Order Blocks, Liquidity Sweeps, and Trend Lines. Each module can be toggled on or off independently.
Market Structure (ZigZag + CHoCH / BoS)
The indicator uses a ZigZag algorithm to identify swing highs and swing lows based on a configurable lookback length. Once a swing point is confirmed, the indicator tracks whether price breaks above a previous swing high or below a previous swing low.
When a break occurs, it is classified as either:
- CHoCH (Change of Character) — the break reverses the prevailing trend direction. For example, if the market was making lower lows and price breaks above the last swing high, this signals a potential trend reversal.
- BoS (Break of Structure) — the break continues the current trend. A higher high in an uptrend or a lower low in a downtrend confirms trend continuation.
The last 10 swing points are drawn as a ZigZag overlay, and each structural break is marked with a horizontal dashed line and a label indicating CHoCH or BoS. Lines and labels are colored by direction: teal for bullish breaks, red for bearish.
Order Blocks
An Order Block represents the last significant candle before a structural break. When a bullish break occurs, the indicator identifies the candle with the lowest low between the broken swing high and the current bar, and draws a rectangular zone from that low extending upward by one ATR(14). For bearish breaks, it finds the candle with the highest high and draws the zone downward.
Order Blocks remain visible as long as price has not closed through them. Once price closes beyond the key level, the block is marked as broken and removed from the chart. The indicator displays a maximum of 3 unbroken Order Blocks per side (bullish and bearish), showing always the most recent ones.
Liquidity Sweeps
Liquidity levels are detected using pivot highs and pivot lows with a configurable lookback length (default 30 bars). These represent areas where stop-loss orders are likely concentrated.
Active liquidity levels (not yet touched) are drawn as solid horizontal lines extending to the current bar. When price breaks through a liquidity level:
- The line style changes to dashed, ending at the bar where the break occurred.
- If price breaks through but closes back on the other side (a sweep), an “x” marker is placed at the sweep location, indicating a potential liquidity grab and reversal signal.
Up to 7 active levels and 7 broken levels are displayed per side.
Trend Lines
The indicator automatically draws trend lines by connecting the two most recent pivot lows (bullish trend line) and the two most recent pivot highs (bearish trend line), using a separate detection sensitivity parameter.
Trend lines are extended to the current bar using slope projection. Only valid slopes are drawn: positive for bullish, negative for bearish. This prevents meaningless flat or counter-directional lines from appearing on the chart.
Parameters
showMS — Toggle Market Structure module (1 = show, 0 = hide). Default: 1.
showLiq — Toggle Liquidity Sweeps module. Default: 1.
showOB — Toggle Order Blocks module. Default: 1.
showTL — Toggle Trend Lines module. Default: 1.
zzLen — ZigZag lookback length for swing detection. Default: 9.
liqLen — Pivot lookback length for liquidity level detection. Default: 30.
maxOBShow — Maximum number of Order Blocks displayed per side (bullish/bearish). Default: 3.
tlSens — Trend Line detection sensitivity (pivot lookback). Default: 20.
Code
//--------------------------------------------
// PRC_Price Action Toolkit (by UAlgo)
// version = 0
// 17.03.2026
// Iván González @ www.prorealcode.com
// Sharing ProRealTime knowledge
//--------------------------------------------
defparam drawonlastbaronly = true
//--------------------------------------------
// ── PARAMETERS ──
//--------------------------------------------
// Toggle modules: 1=show, 0=hide
showMS = 1
showLiq = 1
showOB = 1
showTL = 1
// Settings
zzLen = 9
liqLen = 30
maxOBShow = 3
tlSens = 20
// ── COLORS (RGB) ──
// Bullish: teal
bR = 0
bG = 153
bB = 129
// Bearish: red
sR = 242
sG = 54
sB = 69
//--------------------------------------------
// CALCULATION SECTION
//--------------------------------------------
myATR = averagetruerange[14]
// ── STATE VARIABLES ──
once trendDir = 1
once drewUp = 0
once drewDown = 0
once stateDir = 0
once swCount = 0
once msCount = 0
once obCount = 0
once blCount = 0
once ulCount = 0
once lastSHPrice = -1
once lastSHBar = -1
once lastSLPrice = -1
once lastSLBar = -1
// ── ZIGZAG TREND DETECTION ──
toUp = 0
toDown = 0
if barindex >= 2 * zzLen then
if high[zzLen] >= highest[zzLen](high) then
toUp = 1
endif
if low[zzLen] <= lowest[zzLen](low) then
toDown = 1
endif
endif
// Trend flip
if trendDir = 1 and toDown = 1 then
trendDir = -1
elsif trendDir = -1 and toUp = 1 then
trendDir = 1
endif
if barindex > zzLen then
trendChanged = (trendDir <> trendDir[1])
else
trendChanged = 0
endif
// ── NEW SWING HIGH (trend flipped from -1 to 1) ──
if trendChanged and trendDir = 1 then
lastSHPrice = high[zzLen]
lastSHBar = barindex - zzLen
$swBar[swCount] = barindex - zzLen
$swPrice[swCount] = high[zzLen]
$swType[swCount] = 1
swCount = swCount + 1
drewUp = 0
endif
// ── NEW SWING LOW (trend flipped from 1 to -1) ──
if trendChanged and trendDir = -1 then
lastSLPrice = low[zzLen]
lastSLBar = barindex - zzLen
$swBar[swCount] = barindex - zzLen
$swPrice[swCount] = low[zzLen]
$swType[swCount] = -1
swCount = swCount + 1
drewDown = 0
endif
// ── BEARISH BREAK (close < last swing low) ──
if lastSLPrice > 0 and drewDown = 0 then
if close < lastSLPrice then
if stateDir = 0 or stateDir = 1 then
mType = 1
else
mType = 2
endif
stateDir = -1
drewDown = 1


// Store CHoCH/BoS label
$msBar[msCount] = round((lastSLBar + barindex) / 2)
$msPrice[msCount] = lastSLPrice
$msType[msCount] = mType
$msDir[msCount] = -1
$msLineBar1[msCount] = lastSLBar
$msLineBar2[msCount] = barindex
msCount = msCount + 1


// Bearish Order Block: highest candle in the range
if showOB = 1 then
dist = barindex - lastSLBar
maxVal = -1
obLoc = barindex
if dist > 0 then
for i = 0 to dist do
if high[i] > maxVal then
maxVal = high[i]
obLoc = barindex - i
endif
next
else
maxVal = high
obLoc = barindex
endif
$obVal[obCount] = maxVal
$obBar[obCount] = obLoc
$obSide[obCount] = -1
$obBrk[obCount] = 0
$obATR[obCount] = myATR
obCount = obCount + 1
endif
endif
endif
// ── BULLISH BREAK (close > last swing high) ──
if lastSHPrice > 0 and drewUp = 0 then
if close > lastSHPrice then
if stateDir = 0 or stateDir = -1 then
mType = 1
else
mType = 2
endif
stateDir = 1
drewUp = 1


// Store CHoCH/BoS label
$msBar[msCount] = round((lastSHBar + barindex) / 2)
$msPrice[msCount] = lastSHPrice
$msType[msCount] = mType
$msDir[msCount] = 1
$msLineBar1[msCount] = lastSHBar
$msLineBar2[msCount] = barindex
msCount = msCount + 1


// Bullish Order Block: lowest candle in the range
if showOB = 1 then
dist = barindex - lastSHBar
minVal = 999999999
obLoc = barindex
if dist > 0 then
for i = 0 to dist do
if low[i] < minVal then
minVal = low[i]
obLoc = barindex - i
endif
next
else
minVal = low
obLoc = barindex
endif
$obVal[obCount] = minVal
$obBar[obCount] = obLoc
$obSide[obCount] = 1
$obBrk[obCount] = 0
$obATR[obCount] = myATR
obCount = obCount + 1
endif
endif
endif
// ── UPDATE ORDER BLOCKS (mark broken) ──
if obCount > 0 then
for i = 0 to obCount - 1 do
if $obBrk[i] = 0 then
if $obSide[i] = 1 and close < $obVal[i] then
$obBrk[i] = 1
elsif $obSide[i] = -1 and close > $obVal[i] then
$obBrk[i] = 1
endif
endif
next
endif
// ── LIQUIDITY DETECTION ──
if barindex >= 2 * liqLen and showLiq = 1 then
// Bearish liquidity (pivot high)
if high[liqLen] = highest[2 * liqLen + 1](high) then
$blVal[blCount] = high[liqLen]
$blBar[blCount] = barindex - liqLen
$blBrk[blCount] = 0
$blBrkBar[blCount] = 0
$blSwept[blCount] = 0
$blSwBar[blCount] = 0
blCount = blCount + 1
endif


// Bullish liquidity (pivot low)
if low[liqLen] = lowest[2 * liqLen + 1](low) then
$ulVal[ulCount] = low[liqLen]
$ulBar[ulCount] = barindex - liqLen
$ulBrk[ulCount] = 0
$ulBrkBar[ulCount] = 0
$ulSwept[ulCount] = 0
$ulSwBar[ulCount] = 0
ulCount = ulCount + 1
endif
endif


// ── UPDATE LIQUIDITY (detect sweeps) ──
if blCount > 0 then
for i = 0 to blCount - 1 do
if $blBrk[i] = 0 then
if high > $blVal[i] then
$blBrk[i] = 1
$blBrkBar[i] = barindex
if close < $blVal[i] then
$blSwept[i] = 1
$blSwBar[i] = barindex
endif
endif
endif
next
endif


if ulCount > 0 then
for i = 0 to ulCount - 1 do
if $ulBrk[i] = 0 then
if low < $ulVal[i] then
$ulBrk[i] = 1
$ulBrkBar[i] = barindex
if close > $ulVal[i] then
$ulSwept[i] = 1
$ulSwBar[i] = barindex
endif
endif
endif
next
endif


// ── TREND LINES (valuewhen pattern) ──
once tlBearEnd = -1
once tlBearEndVal = 0
once tlBearStart = -1
once tlBearStartVal = 0
once tlBullEnd = -1
once tlBullEndVal = 0
once tlBullStart = -1
once tlBullStartVal = 0


if barindex >= 2 * tlSens and showTL = 1 then
if high[tlSens] = highest[2 * tlSens + 1](high) then
tlBearStart = tlBearEnd
tlBearStartVal = tlBearEndVal
tlBearEnd = barindex - tlSens
tlBearEndVal = high[tlSens]
endif
if low[tlSens] = lowest[2 * tlSens + 1](low) then
tlBullStart = tlBullEnd
tlBullStartVal = tlBullEndVal
tlBullEnd = barindex - tlSens
tlBullEndVal = low[tlSens]
endif
endif


//--------------------------------------------
// DRAWING SECTION
//--------------------------------------------
if islastbarupdate then


// ── ZIGZAG SEGMENTS (last 10 swings) ──
if showMS = 1 and swCount >= 2 then
startSw = max(0, swCount - 11)
for i = startSw to swCount - 2 do
drawsegment($swBar[i], $swPrice[i], $swBar[i + 1], $swPrice[i + 1]) coloured(128, 128, 128) style(line, 1)
next
endif


// ── MARKET STRUCTURE LABELS (last 10) ──
if showMS = 1 and msCount > 0 then
startMs = max(0, msCount - 10)
for i = startMs to msCount - 1 do
// Horizontal break line (colored by direction)
if $msDir[i] = -1 then
drawsegment($msLineBar1[i], $msPrice[i], $msLineBar2[i], $msPrice[i]) coloured(sR, sG, sB) style(dottedline, 1)
else
drawsegment($msLineBar1[i], $msPrice[i], $msLineBar2[i], $msPrice[i]) coloured(bR, bG, bB) style(dottedline, 1)
endif


atrOff = myATR * 0.3
// CHoCH bearish
if $msType[i] = 1 and $msDir[i] = -1 then
drawtext("CHoCH", $msBar[i], $msPrice[i] + atrOff) coloured(sR, sG, sB)
endif
// CHoCH bullish
if $msType[i] = 1 and $msDir[i] = 1 then
drawtext("CHoCH", $msBar[i], $msPrice[i] - atrOff) coloured(bR, bG, bB)
endif
// BoS bearish
if $msType[i] = 2 and $msDir[i] = -1 then
drawtext("BoS", $msBar[i], $msPrice[i] + atrOff) coloured(sR, sG, sB)
endif
// BoS bullish
if $msType[i] = 2 and $msDir[i] = 1 then
drawtext("BoS", $msBar[i], $msPrice[i] - atrOff) coloured(bR, bG, bB)
endif
next
endif


// ── ORDER BLOCKS (last N unbroken per side) ──
if showOB = 1 and obCount > 0 then
bullShown = 0
bearShown = 0
for j = 0 to obCount - 1 do
i = obCount - 1 - j
if $obBrk[i] = 0 then
if $obSide[i] = 1 and bullShown < maxOBShow then
drawrectangle($obBar[i], $obVal[i], barindex + 5, $obVal[i] + $obATR[i]) coloured(bR, bG, bB) fillcolor(bR, bG, bB, 50)
bullShown = bullShown + 1
endif
if $obSide[i] = -1 and bearShown < maxOBShow then
drawrectangle($obBar[i], $obVal[i] - $obATR[i], barindex + 5, $obVal[i]) coloured(sR, sG, sB) fillcolor(sR, sG, sB, 50)
bearShown = bearShown + 1
endif
endif
if bullShown >= maxOBShow and bearShown >= maxOBShow then
break
endif
next
endif


// ── LIQUIDITY LINES ──
if showLiq = 1 then
// Bearish liquidity (active = solid, broken = dashed)
blShown = 0
blBrkShown = 0
if blCount > 0 then
for j = 0 to blCount - 1 do
i = blCount - 1 - j
if $blBrk[i] = 0 and blShown < 7 then
drawsegment($blBar[i], $blVal[i], barindex, $blVal[i]) coloured(sR, sG, sB) style(line, 1)
blShown = blShown + 1
endif
if $blBrk[i] = 1 and blBrkShown < 7 then
drawsegment($blBar[i], $blVal[i], $blBrkBar[i], $blVal[i]) coloured(sR, sG, sB) style(dottedline, 1)
if $blSwept[i] = 1 then
drawtext("x", $blSwBar[i], $blVal[i] + myATR * 0.2) coloured(156, 39, 176)
endif
blBrkShown = blBrkShown + 1
endif
next
endif


// Bullish liquidity (active = solid, broken = dashed)
ulShown = 0
ulBrkShown = 0
if ulCount > 0 then
for j = 0 to ulCount - 1 do
i = ulCount - 1 - j
if $ulBrk[i] = 0 and ulShown < 7 then
drawsegment($ulBar[i], $ulVal[i], barindex, $ulVal[i]) coloured(bR, bG, bB) style(line, 1)
ulShown = ulShown + 1
endif
if $ulBrk[i] = 1 and ulBrkShown < 7 then
drawsegment($ulBar[i], $ulVal[i], $ulBrkBar[i], $ulVal[i]) coloured(bR, bG, bB) style(dottedline, 1)
if $ulSwept[i] = 1 then
drawtext("x", $ulSwBar[i], $ulVal[i] - myATR * 0.2) coloured(0, 128, 128)
endif
ulBrkShown = ulBrkShown + 1
endif
next
endif
endif


// ── TREND LINES ──
if showTL = 1 then
// Bearish trend line (connecting last 2 pivot highs)
if tlBearStart > 0 and tlBearEnd > tlBearStart then
tlBearSlope = (tlBearEndVal - tlBearStartVal) / (tlBearEnd - tlBearStart)
if tlBearSlope < 0 then
tlBearExtVal = tlBearEndVal + tlBearSlope * (barindex - tlBearEnd)
drawsegment(tlBearStart, tlBearStartVal, barindex, tlBearExtVal) coloured(sR, sG, sB) style(line, 2)
endif
endif


// Bullish trend line (connecting last 2 pivot lows)
if tlBullStart > 0 and tlBullEnd > tlBullStart then
tlBullSlope = (tlBullEndVal - tlBullStartVal) / (tlBullEnd - tlBullStart)
if tlBullSlope > 0 then
tlBullExtVal = tlBullEndVal + tlBullSlope * (barindex - tlBullEnd)
drawsegment(tlBullStart, tlBullStartVal, barindex, tlBullExtVal) coloured(bR, bG, bB) style(line, 2)
endif
endif
endif


endif
//--------------------------------------------
return
