

Pre-Market session USA
January 7, 2019, 2:47 PM
Indicators
5 Comments
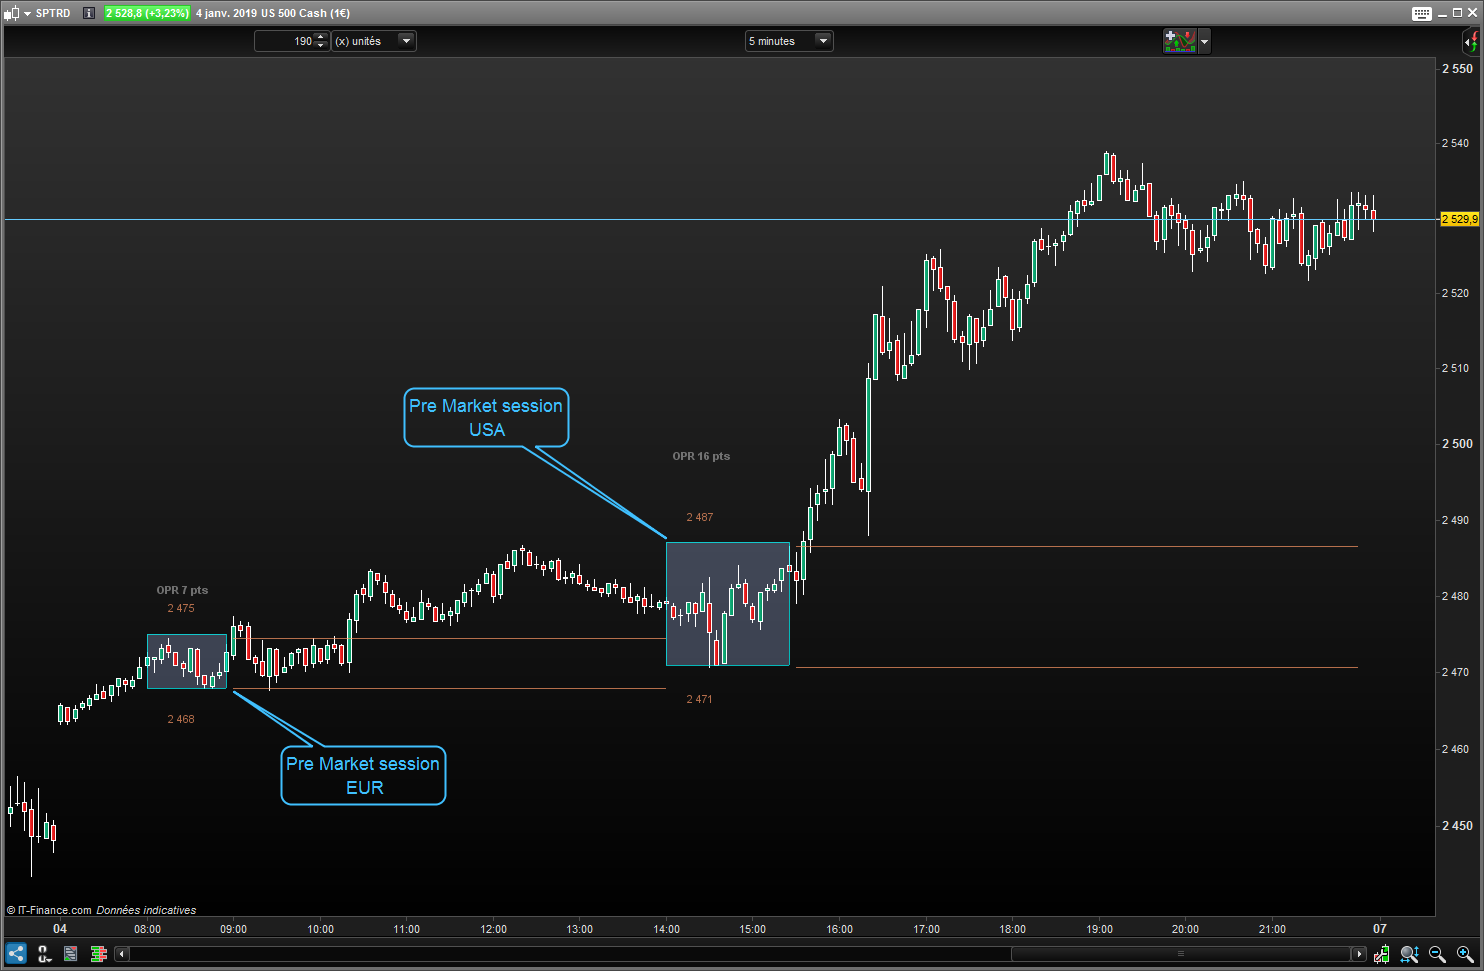
► This Indicator draws a rectangle around the candlesticks formed during the Pre-opening of the American Session, it provides the minimum, maximum values as well as the difference and draws segments from the highest and the lowest
until the closing of the American Session…
[Properties] Two checkboxes
– “Info” Shows or hides alphanumeric information
– “Segment” Shows or hides the lines (higher / lower)
Two variables used to
– “Alpha” Adjust the transparency of text and lines (0 to 255)
– “Delta” Adjusts the information (above and below) of the rectangle
(to adjust according to the selected asset)
// Pre-Market USA (Opening Range) | Graph Indicator
// 04.01.2019 (Release 1.0)
// Swapping @ www.forexswap.fr
// Sharing ProRealTime knowledge (alt+16)

DefParam CalculateOnLastBars = 150 // (visualisation en UT 5mn sur une seule journée)
// --- property settings
Info    = 1   // (0=false; 1=true)
Delta   = 10  // gap number/rectangle
Alpha   = 180 // transparency letter
Segment = 1   // (0=false; 1=true)
// --- end


starttime = 140500 // 14h05 plage américaine (Nasdaq, S&P, Dowjones, ect...)
endtime = 153000   // 15h30

// --- init
alpha = max(alpha,0)
alpha = min(alpha,255)
// --- end

if time = starttime then
 startbar = barindex
endif
if time = endtime then
 endbar = barindex
endif

if time >= starttime and time <= endtime then
 if high > hh then
  hh = high
 endif
 if low < ll or ll = 0 then
  ll = low
 endif
endif

hh = round(hh) // résultat valeur arrondi
ll = round(ll) // résultat valeur arrondi

if intradaybarindex = 0 then
 hh = 0
 ll = 0
endif

if time > endtime then
 DrawRectangle(startbar,hh,endbar,ll) coloured(0,255,255,alpha) // alpha (transparence)
endif

if time = endtime then
 upper = highest[18](high) // 18 Chandeliers de 5mn dans 90 minutes
 lower = lowest[18](low)
 dif = round(abs(upper-lower))
 info = info // Visualisation des valeurs Alpha Numériques
elsif info = 1 then
 DrawText("OPR #dif#pts",startbar+5,upper+(delta+dif/2),SansSerif,Bold,11) coloured(150,150,150,alpha)
 DrawText("#hh#",startbar+5,upper+(delta),SansSerif,Standard,11) coloured(250,150,100,alpha)
 DrawText("#ll#",startbar+5,lower-(delta),SansSerif,Standard,11) coloured(250,150,100,alpha)
endif

if time >= 154000 and time <= 220500 then
 segment = segment // Visualisation Segment "Haut/Bas" OPR de 15h30 à 22h00
 DrawSegment(barindex-segment,upper,barindex,upper) coloured(250,150,100,alpha) // Ligne Supérieure OPR (Résistance)
 DrawSegment(barindex-segment,lower,barindex,lower) coloured(250,150,100,alpha) // Ligne Inférieure OPR (Support)
endif

return
Download
Filename:
PreMarket-USA-Session.itf
Downloads:
323
Master
<a href="http://www.forexswap.fr/">Le trading</a> une discipline sans faille qui en décourage plus d'un ! "Et pourtant..."
Author’s Profile
Loading...