

Pivot Reversal Strategy Alerts
February 14, 2019, 1:34 PM
Indicators
17 Comments
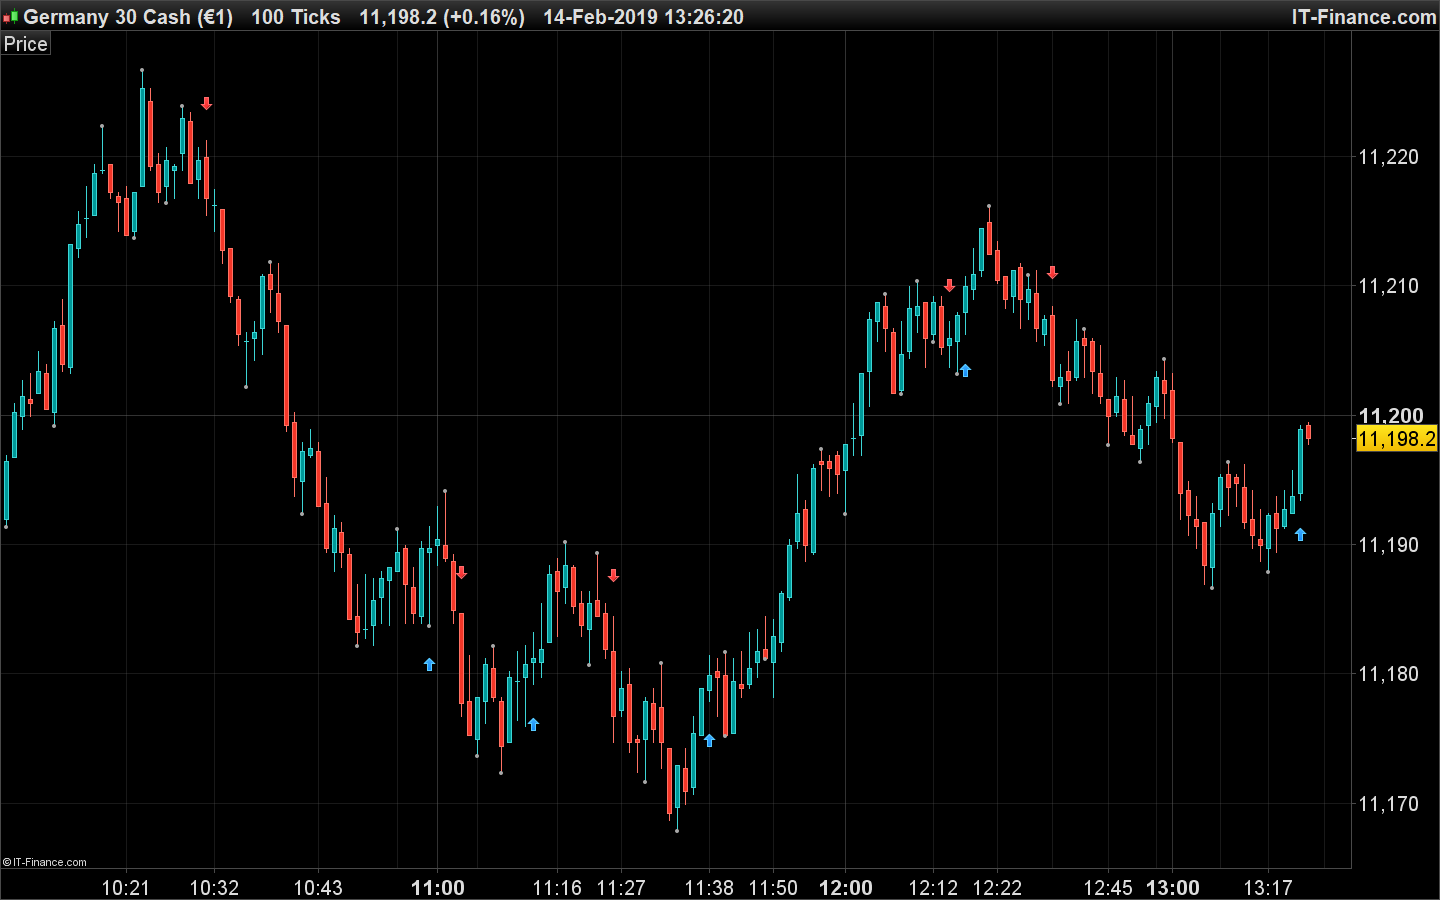
This “trading signals” indicator plots buy and sell signals points entries when the price breaks the last pivot High/Low levels.
These levels are defined by price tops and bottoms found after the price made:
- highest high with “leftP” candles on its left and “rightP” candles on its right
- lowest low with “leftP” candles on its left and “rightP” candles on its right
The levels are marked with dark grey dots on the charts.
The signals are given during the candlestick formation and not afterwards.
//PRC_Pivot Reversal Strategy | indicator
//14.02.2019
//Nicolas @ www.prorealcode.com
//Sharing ProRealTime knowledge

// --- settings
leftp = 4
rightp = 2
// --- end of settings

period=max(leftp,rightp)
hh = highest[period](high)
ll = lowest[period](low)

if hh<>hh[1] then
 hhbar=barindex
 hhprice=high
endif
if ll<>ll[1] then
 llbar=barindex
 llprice=low
endif

if barindex-hhbar=rightp then
 drawtext("•",hhbar,hhprice) coloured(168,168,168)
 top=hhprice
endif
if barindex-llbar=rightp then
 drawtext("•",llbar,llprice) coloured(168,168,168)
 bottom=llprice
endif

atr=averagetruerange[14]
if high crosses over top and lastsig<=0 then
 drawarrowup(barindex,low-atr/2) coloured(30,144,255)
 lastsig=1
endif
if low crosses under bottom and lastsig>=0 then
 drawarrowdown(barindex,high+atr/2) coloured(255,48,48)
 lastsig=-1
endif

RETURN
Download
Filename:
PRC_Pivot-Reversal-Strategy.itf
Downloads:
1010
Master
I created ProRealCode because I believe in the power of shared knowledge. I spend my time coding new tools and helping members solve complex problems.
If you are stuck on a code or need a fresh perspective on a strategy, I am always willing to help. Welcome to the community!
Author’s Profile
Loading...