

Pivot point Supertrend
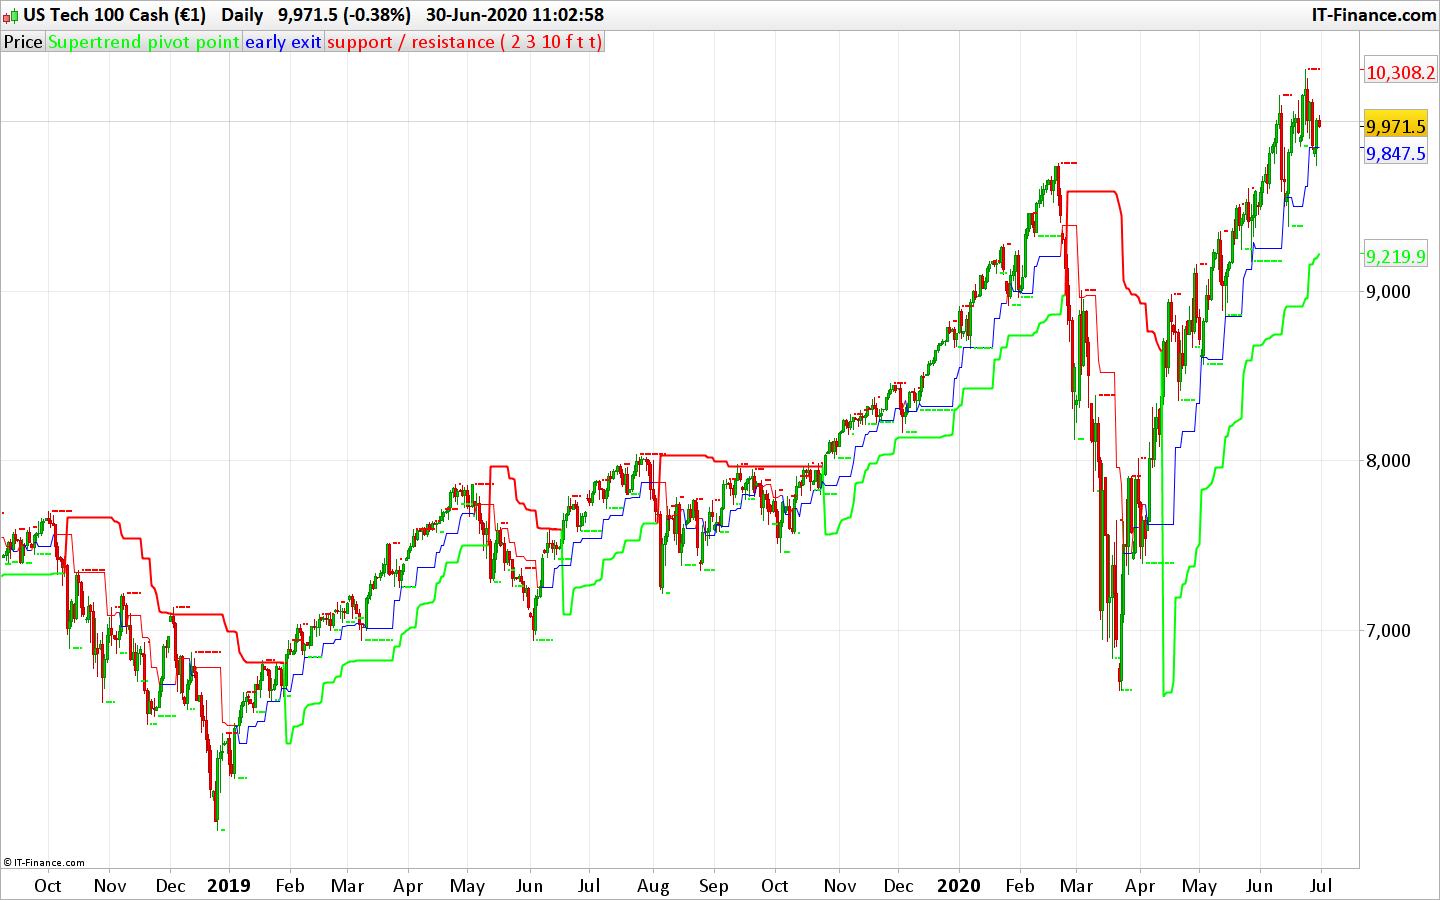
The Pivot point Supertrend uses the high/low pivot points (same as fractals) to calculate the Supertrend levels and therefore create a trend following / trailing stoploss indicator. This code was converted from pinescript version following a request in the indicator forum section (author: Lonesome TheBlue, all credits to him).
There are many types of SuperTrend around. Recently I thought about a Supertrend based on Pivot Points then I wrote “Pivot Point SuperTrend” script. It looks it has better performance on keeping you in the trend more.
The idea is behind this script is finding pivot point , calculating average of them and like in supertrend creating higher/lower bands by ATR. As you can see in the algorithm the script gives weigth to past pivot points , this is done for smoothing it a bit.
As an option the script can show main center line and I realized that when you are in a position, this line can be used as early exit points. (maybe half of the position size).
While using Pivot Points , I added support resistance lines by using Pivot Point , as an option the script can show S/R lines.
And also it can show Pivot Points.
(author description).
//PRC_Pivot Point Supertrend | indicator
//30.06.2020
//Nicolas @ www.prorealcode.com
//Sharing ProRealTime knowledge
//converted from pinescript

// -- settings
prd = 2 //Pivot Point Period
Factor = 3 //ATR Factor
Pd = 10 //ATR Period
showpivot = 0 // Show Pivot Points (1 = true ; 0 =false)
showcl = 0 //Show PP Center Line (1 = true ; 0 =false)
showsr = 0 //Show Support/Resistance (1 = true ; 0 =false)
// --- end of settings

atr = averagetruerange[14]
if high[prd] >= highest[(prd)*2+1](high) then
 ph = high[prd]
 if showpivot then
  drawtext("H",barindex[prd],ph+atr/2,dialog,standard,20) coloured(255,0,0)
 endif
 lastpp = ph
endif

if low[prd] <= lowest[(prd)*2+1](low)  then
 pl = low[prd]
 if showpivot then
  drawtext("L",barindex[prd],pl-atr/2,dialog,standard,20) coloured(0,255,0)
 endif
 lastpp = pl
endif

if lastpp<>lastpp[1] then
 if center=0 then
  center = lastpp
 else
  center = (center * 2 + lastpp) / 3
 endif
endif
Up = center - (Factor * averagetruerange[Pd])
Dn = center + (Factor * averagetruerange[Pd])

Trend = 0
if close[1] > TUp[1] then
 TuP = max(Up, TUp[1])
else
 TuP= Up
endif
if close[1] < TDown[1] then
 TDown= min(Dn, TDown[1])
else
 TDown= Dn
endif
if close > TDown[1] then
 trend = 1
elsif close < TUp[1] then
 trend = -1
else
 trend = Trend[1]
endif

once trend=1
if Trend = 1 then
 trailingsl =  TUp
 r=0
 g=255
else
 trailingsl = TDown
 r=255
 g=0
endif

if showcl then
 alpha=255
 if center<medianprice then
  clr=0
  clb=255
 else
  clr=255
  clb=0
 endif
endif

sr = undefined
if showsr then
 sr = lastpp
 if lastpp=ph then
  srr=255
  srg=0
 else
  srr=0
  srg=255
 endif
endif

return trailingsl coloured(r,g,0) style(line,2) as "Supertrend pivot point", center coloured(clr,0,clb,alpha) as "early exit", sr coloured(srr,srg,0) style(point,2) as "support / resistance"