

Pivot Line Analysis Market Sentiment Indicator
Analysis of today’s pivot line positions relative to yesterdays pivot line positions can give us a very good idea of market sentiment.
This simple indicator helps us see market sentiment at a glance. It can be applied on any time frame and any market.
- Rising Pivots. If today’s R1 is higher than yesterdays R1 and today’s S1 is higher than yesterdays S1 then sentiment is bullish.
- Falling Pivots. If today’s R1 is lower than yesterdays R1 and today’s S1 is lower than yesterdays S1 then sentiment is bearish.
- Outside Pivots. If today’s R1 is higher than yesterdays R1 and today’s S1 is lower than yesterdays S1 then the bulls and bears had a big fight resulting in increased volatility and the market may be at a point of indecision.
- Inside Pivots. If today’s R1 is lower than yesterdays R1 and today’s S1 is higher than yesterdays S1 then the bulls and bears had a very evenly matched fight and the market may be at a point of indecision.
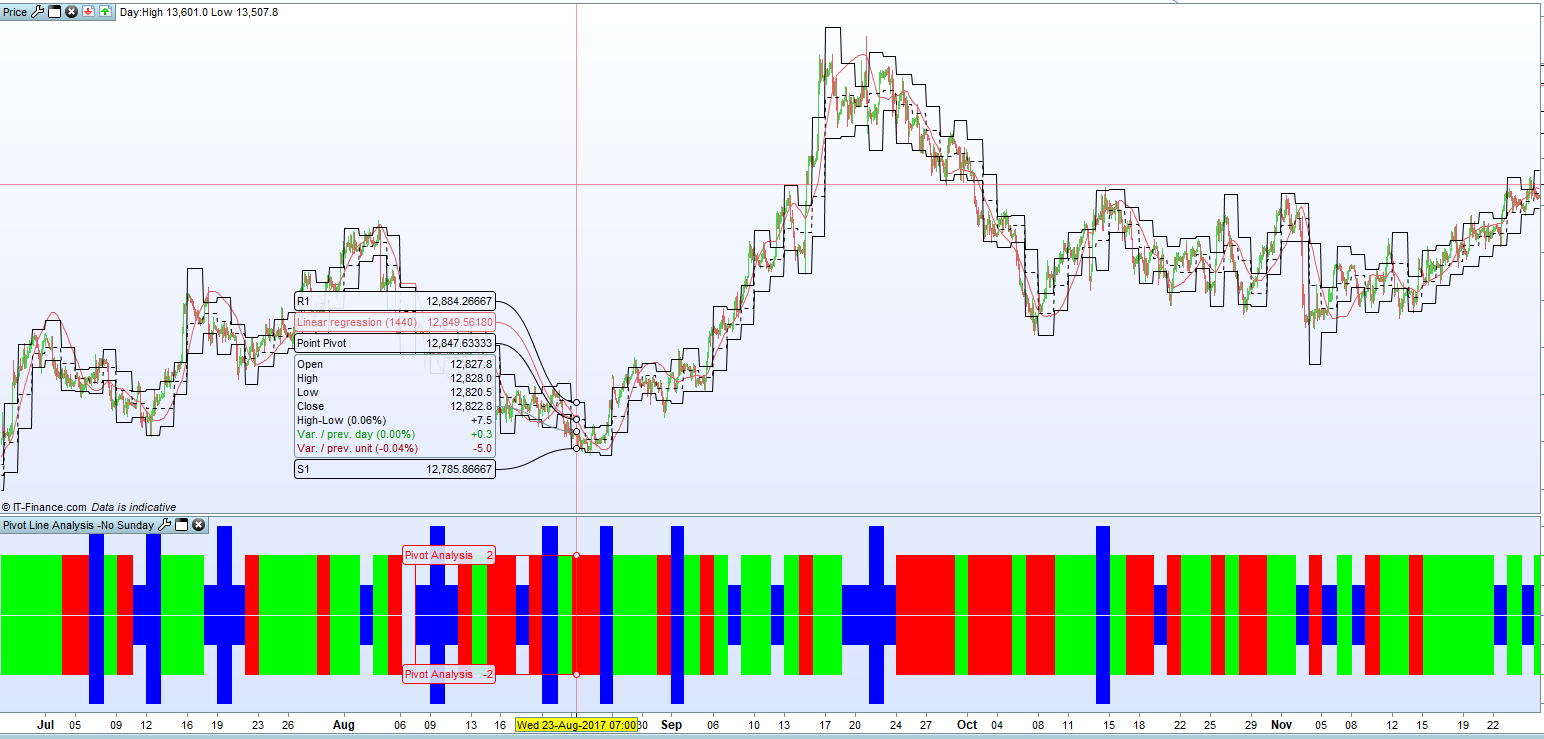
A green bar indicates that yesterday was a bullish day.
A red bar indicates that yesterday was a bearish day.
A long blue bar indicates that yesterday was a more volatile day that neither side won.
A short blue bar indicates that yesterday was a day of indecision.
The latter two are of the most interest and can be used to predict possible changes of market direction.
I have written a simple strategy based on this theory which is currently under forward testing. Hopefully to be shared later!
a1=OpenDayOfWeek

b1=DHigh(1)
b2=DHigh(2)
c1=DLow(1)
c2=DLow(2)
d1=DClose(1)
d2=DClose(2)
IF a1=1 THEN
b1=b2
c1=c2
d1=d2
ELSE
b1=b1
c1=c1
d1=d1
ENDIF

H1 = b1//High
L1 = c1//Low
C = d1//Close

aa1=OpenDayOfWeek

bb1=DHigh(2)
bb2=DHigh(3)
//bb3= DHigh(3)
cc1=DLow(2)
cc2=DLow(3)
//cc3=DLow(1)
dd1=DClose(2)
dd2=DClose(3)
//dd3=DClose(1)

IF aa1=7 or aa1=1 or aa1=2 THEN
 bb1=bb2
 cc1=cc2
 dd1=dd2
ELSE
 bb1=bb1
 cc1=cc1
 dd1=dd1
ENDIF

HH1 = bb1//High
LL1 = cc1//Low
CC = dd1//Close

//Pivot1 = (HH1 + LL1 + CC) / 3
R11 = 2*((HH1 + LL1 + CC) / 3)- LL1
S11 = 2*((HH1 + LL1 + CC) / 3)- HH1
//Pivot = (H1 + L1 + C) / 3
R1 = 2*((H1 + L1 + C) / 3)- L1
S1 = 2*((H1 + L1 + C) / 3)- H1

//Outside Pivot
IF R1 > R11 and S1 < S11 THEN
 Flagup = 3
 FlagDown = -3
 R = 0
 G = 0
 B = 255
ENDIF

//Up Pivot
IF R1 > R11 and S1 > S11 THEN
 Flagup = 2
 FlagDown = -2
 R = 0
 G = 255
 B = 0
ENDIF

//Down Pivot
IF R1 < R11 and S1 < S11 THEN
 Flagup = 2
 FlagDown = -2
 R = 255
 G = 0
 B = 0
ENDIF

//Inside Pivot
IF R1 < R11 and S1 > S11 THEN
 FlagUp = 1
 FlagDown = -1
 R = 0
 G = 0
 B = 255
ENDIF

return FlagUp coloured(R,G,B) Style(Histogram,2) as "Pivot Analysis",FlagDown coloured(R,G,B) Style(Histogram,2) as "Pivot Analysis"