

PID Pressure Indicator — Applying Control Theory to Futures Trading
Most oscillators tell you where the price is. This one tells you what it is doing relative to the market’s own equilibrium — and how much conviction is behind it.
The PID Pressure Indicator borrows its logic from industrial control systems. In engineering, a PID regulator (Proportional-Integral-Derivative) is used to measure the deviation of a system from a target value and compute a corrective force. We apply the same three-part structure to price action — not to control the market, but to read the pressure building inside it.
Mapping PID Components to Price Action
A classic PID controller has three components, each reading a different dimension of the deviation between a system and its reference. Here is how each maps to market behavior.
P — Proportional: The Instantaneous Gap
P = Close - VWAP
The simplest piece. How far is the current price from the session’s volume-weighted average? A large positive P means the price has moved well above where most volume traded. A large negative P means the opposite. This is the current tension — it is directional but has no memory.
I — Integral: Accumulated Pressure
I = Sum of P over N bars
If the price stays above VWAP for many consecutive bars, the integral grows. It captures persistent imbalance — the kind that builds during a real trend rather than a random spike. When I is rising, the market is not just above equilibrium, it has been there for a while. This is the structural component of the signal.
D — Derivative: Acceleration
D = P - P[1]
The rate of change of the gap. If P is growing faster and faster, D is positive and amplifies the signal — the move is accelerating. If P is shrinking, D is negative and acts as a brake — the move is losing steam. This is the early warning component, the one most sensitive to reversals.
Why VWAP as the Reference?
The VWAP (Volume-Weighted Average Price) is the natural equilibrium anchor for intraday futures trading. It is the benchmark used by institutional desks to evaluate execution quality. When price deviates from VWAP, there is a known and measurable tension — and market forces tend to pull it back over time.
The VWAP used here resets at the start of each session using INTRADAYBARINDEX, making it a true intraday reference rather than a rolling average.
Dynamic Coefficients — Adapting to Volatility
In a standard PID controller, the three gains (Kp, Ki, Kd) are fixed. Fixed gains work well in stable systems — but markets constantly shift between high and low volatility regimes. A coefficient that is perfect during a trending session becomes noisy during a choppy one.
The solution: make the gains respond to the current volatility regime.
The volatility ratio compares the current ATR to its own 50-bar average:
volRatio = ATR(14) / AVERAGE[50](ATR(14))
A volRatio above 1.0 means volatility is elevated. Below 1.0, the market is calm.
The gains are then adjusted as follows:
- Kp Fixed (1.0) Already normalized by ATR — no adjustment needed
- Ki
baseKi / volRatioIn high vol, reduce memory to avoid signal lag - Kd
baseKd × volRatioIn high vol, increase reactivity to catch fast moves
Both are clamped to avoid extreme values:
dynKistays between 0.05 and 1.0dynKdstays between 0.1 and 2.0
The result is an indicator that automatically tightens up when markets are fast-moving and breathes deeper when they are slow.
Signal Normalization
The raw PID output is expressed in price points, which varies wildly between a DAX future and a Crude Oil contract. To make the indicator instrument-agnostic, the composite signal is divided by the current ATR:
signal = (dynKp × P + dynKi × I + dynKd × D) / ATR(14)
This produces a dimensionless oscillator that reads consistently across any futures market, at any price level.
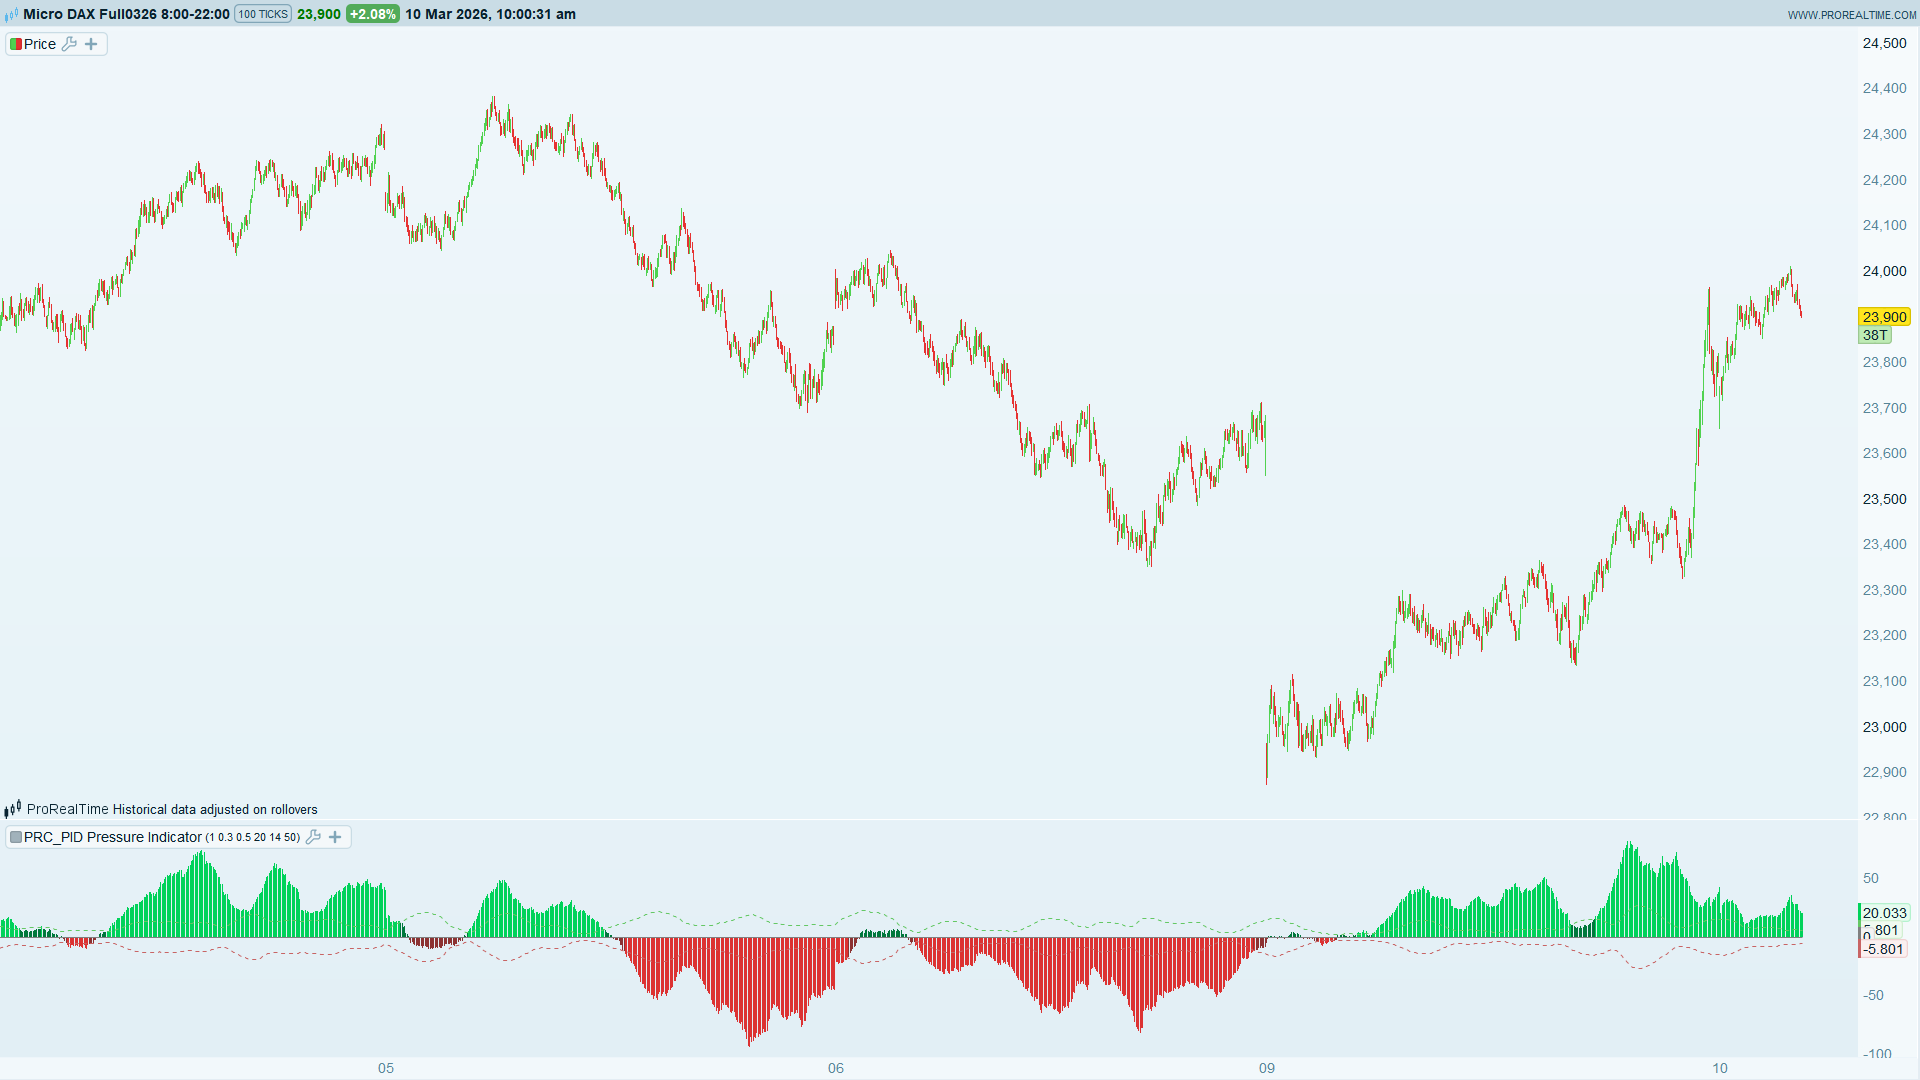
Visual Structure
The indicator plots in a separate panel with four visual elements:
The histogram — the composite PID signal, displayed in four colors:
- Bright greenSignal > upper band (Strong bullish pressure)
- Dark greenSignal > 0 (Moderate bullish pressure)
- Dark redSignal < 0 (Moderate bearish pressure)
- Bright redSignal < lower band (Strong bearish pressure)
The tension bands — dynamic levels set at ±1 standard deviation of the signal over 50 bars. When the histogram crosses outside these bands, pressure is statistically elevated relative to recent history.
The zero line — the equilibrium axis. A histogram consistently above zero indicates the market is holding above VWAP. Consistently below means the opposite.
// -------------------------------------------------------
// PRC_PID Pressure Indicator - ProRealTime / ProBuilder version
// Nicolas @ www.prorealcode.com
// Learn. Code. Trade. Share.
// -------------------------------------------------------

// --- Base parameters (user tunable) ---
baseKp      = 1.0
baseKi      = 0.3
baseKd      = 0.5
periodI     = 20
periodATR   = 14
periodVol   = 50

// ============================================================
// INTRADAY VWAP — reset each session
// ============================================================
typPrice = (HIGH + LOW + CLOSE) / 3

IF INTRADAYBARINDEX = 0 THEN
   cumVP  = typPrice * VOLUME
   cumVol = VOLUME
ELSE
   cumVP  = cumVP[1] + typPrice * VOLUME
   cumVol = cumVol[1] + VOLUME
ENDIF

IF cumVol > 0 THEN
   vwap = cumVP / cumVol
ELSE
   vwap = CLOSE
ENDIF

// ============================================================
// DYNAMIC COEFFICIENTS
// volRatio > 1 = high volatility, < 1 = low volatility
// ============================================================
atrVal    = AverageTrueRange[periodATR]
atrAvg    = AVERAGE[periodVol](atrVal)

IF atrAvg > 0 THEN
   volRatio = atrVal / atrAvg
ELSE
   volRatio = 1
ENDIF

// Ki decreases in high vol, increases in low vol
// Kd increases in high vol, decreases in low vol
// Kp stays stable (already normalized by ATR)
dynKp = baseKp
dynKi = baseKi / volRatio
dynKd = baseKd * volRatio

// Clamp to avoid extremes
dynKi = MAX(0.05, MIN(dynKi, 1.0))
dynKd = MAX(0.1,  MIN(dynKd, 2.0))

// ============================================================
// PID COMPONENTS
// ============================================================
compP = CLOSE - vwap
compI = SUMMATION[periodI](compP)
compD = compP - compP[1]

// ============================================================
// COMPOSITE SIGNAL — normalized by ATR
// ============================================================
IF atrVal > 0 THEN
   rawSignal = dynKp * compP + dynKi * compI + dynKd * compD
   signal    = rawSignal / atrVal
ELSE
   signal = 0
ENDIF

// ============================================================
// DYNAMIC TENSION BANDS — based on signal std dev
// ============================================================
upperBand =  STD[periodVol](signal)
lowerBand = -STD[periodVol](signal)

// ============================================================
// HISTOGRAM COLOR — 4 states
// ============================================================
IF signal > upperBand THEN
   cR = 0
   cG = 210
   cB = 90
ELSIF signal > 0 THEN
   cR = 0
   cG = 120
   cB = 60
ELSIF signal < lowerBand THEN
   cR = 220
   cG = 50
   cB = 50
ELSE
   cR = 140
   cG = 50
   cB = 50
ENDIF

// ============================================================
// DISPLAY
// ============================================================
RETURN signal STYLE(HISTOGRAM) COLOURED(cR,cG,cB) AS "PID Signal", upperBand STYLE(DOTTEDLINE,1) COLOURED(100,200,100) AS "Tension+", lowerBand STYLE(DOTTEDLINE,1) COLOURED(200,100,100) AS "Tension-", 0 STYLE(LINE,1) COLOURED(128,128,128)
Parameters Reference
baseKp1.0 Proportional gain (Signal feels too flat → increase)baseKi0.3 Integral base gain (Missing trend context → increase)baseKd0.5 Derivative base gain (Reversals not caught early enough → increase)periodI20 Integral memory window (Too noisy → increase; Too slow → decrease)periodATR14 ATR normalization period (Standard — adjust last)periodVol50 Volatility regime window (Shorter = faster regime detection)
How to Read It
- Trending session: The histogram stays consistently on one side of zero. I builds steadily, color stays bright. This is a high-conviction directional signal.
- Exhaustion signal: Price continues making new highs but the histogram starts fading toward zero — or worse, crosses to the other side. This is the D component turning before price does.
- Choppy / ranging session: The histogram oscillates rapidly across zero, rarely reaching the tension bands. Reduce position size or wait for a clearer regime.
- Breakout confirmation: A sudden move into the bright green / bright red zone (beyond the tension band) on a high-volume bar is the indicator firing at full strength. This is the combination of P (large gap), I (pressure already building), and D (acceleration) all aligned.