

PhantomFlow Trend Detector
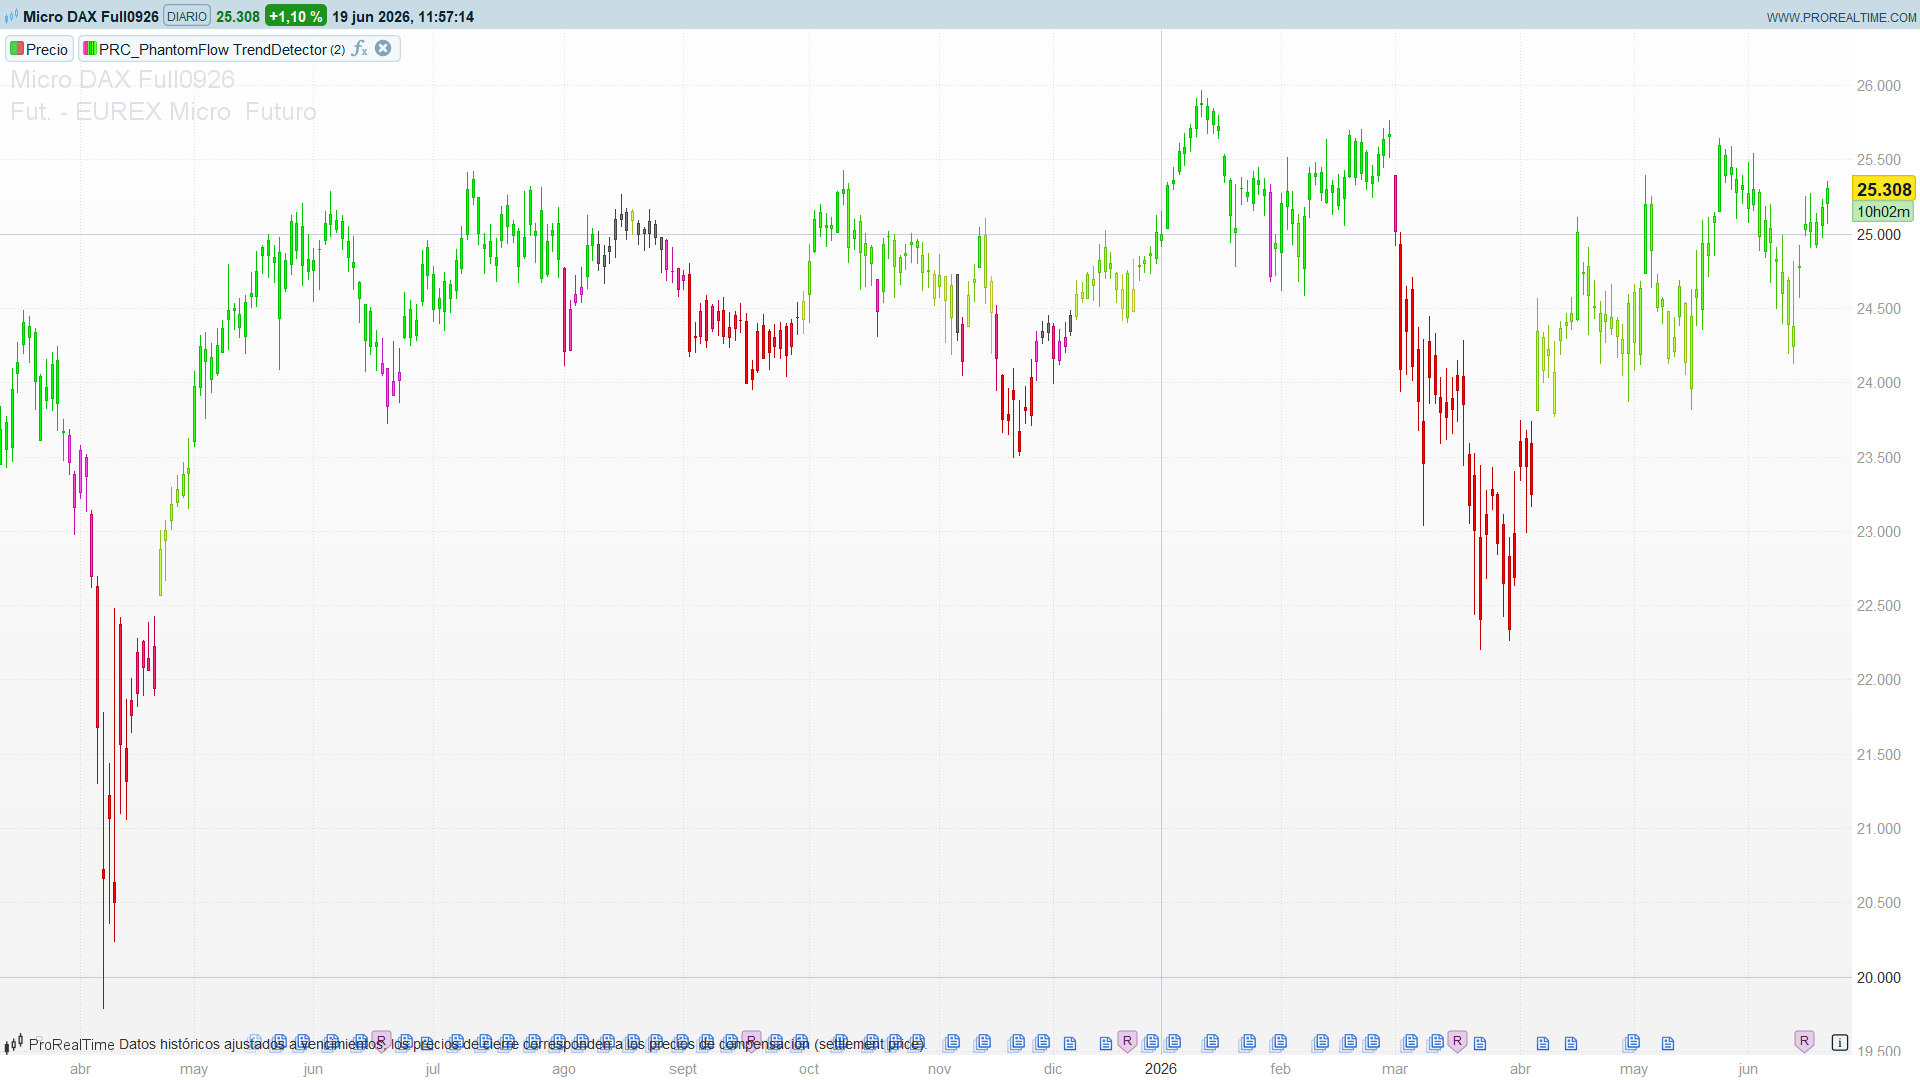
Most trend tools smooth price and call the slope a trend. PhantomFlow Trend Detector, by PhantomFlow_s666ex_, takes a structural route instead: it reads the trend straight from the geometry of swing points. It tracks the market’s fractal highs and lows, groups them into what it calls liquidity waves — runs of three same-side swings that line up in an orderly staircase — and uses the most recent of those waves to decide whether price is in an uptrend, a downtrend, or neither. The verdict is painted directly on the candles as a colour gradient, so the chart itself becomes the read-out: no oscillator, no separate panel.
The result is a trend indicator that only commits when market structure actually agrees. A single swing means nothing; the indicator waits for three aligned swings before it draws a conclusion, which filters out most of the bar-to-bar noise that fools moving-average crossovers. And because the colour is a gradient rather than a binary green/red, it carries a second layer of information: not just which way the trend points, but how close price sits to the level that would invalidate it.
Theory Behind the Indicator
1. Fractal swings — the building block
Everything starts from fractal swing points, in the classic Bill Williams sense. A bar is a fractal high when its high is the highest of the five-bar window centred on it; a fractal low when its low is the lowest of that window:
fractal high : high[2] = highest(5) of high
fractal low  : low[2]  = lowest(5)  of low
Because the window is centred, a fractal is only confirmed two bars after the fact (nZigzag = 2 bars on each side). That lag is the price of certainty — a swing is not declared until the two bars after it fail to exceed it.
2. Zigzag filtering — keeping the structure clean
Raw fractals are noisy: several highs can print before a single low does. The indicator runs them through a zigzag filter so the structure alternates cleanly between highs and lows:
- If a new fractal is the same side as the last one kept (another high after a high), the indicator keeps only the more extreme of the two — the higher high replaces the previous high.
- If a new fractal is the opposite side and confirms a genuine reversal of direction, it is pushed onto the stack as a new pivot.
This is the standard zigzag discipline, implemented with a small state machine that remembers whether the last accepted pivot was a high or a low. What comes out is a clean alternating sequence of swing highs and swing lows.
3. Liquidity waves — the core idea
This is what makes PhantomFlow more than a zigzag. The indicator watches for three consecutive same-side swings that move in an orderly staircase:
- A wave up forms from three swing highs that step down in sequence — three lower highs. Price is being turned away at progressively lower ceilings.
- A wave down forms from three swing lows that step up in sequence — three higher lows. Price is being supported at progressively higher floors.
Each wave defines a price band (its highest and lowest swing) and, crucially, a pivot level that becomes the trend threshold:
- For a wave up, the relevant level is the wave’s lowest swing high (
waveUpLow). Hold above it and the structure of higher-lows-of-the-highs is intact; lose it and the up-structure breaks. - For a wave down, the relevant level is the wave’s highest swing low (
waveDownHigh). Stay below it and the down-structure holds; reclaim it and the down-structure breaks.
These staircases are where resting liquidity tends to pool — under a run of lower highs, over a run of higher lows — which is where the indicator takes its name.
4. From waves to trend
The trend verdict is read from where the current close sits relative to the last active wave (or waves):
- Only a wave up exists — uptrend while
close > waveUpLow. - Only a wave down exists — downtrend while
close < waveDownHigh. - Both exist — the close is compared against both levels. Above the wave-down ceiling it is an uptrend; below the wave-up floor it is a downtrend; and when price sits between the two, the more recent wave wins the tie.
If none of those conditions holds, the indicator declares no trend and leaves the candles a neutral grey. This is the conservative core of the tool: it would rather say “nothing” than force a direction.
5. The colour gradient
Once a direction is set, the active wave gives a high and a low, and the close is normalised to a 0–1 position inside that band:
norm = (close - lastLow) / (lastHigh - lastLow) , clamped to [0, 1]
That fraction drives a two-colour interpolation, computed channel by channel:
- Uptrend — from a warm yellow near the bottom of the band to a bright green near the top. Deep green means price is pressing the upper edge of its structure; yellow means it has drifted back toward the level that would end the uptrend.
- Downtrend — from red near the bottom of the band to magenta near the top. Saturated red means price is pinned to the lows; magenta means it has rallied back toward the ceiling that would end the downtrend.
The candle is then drawn in that exact colour. The gradient is the whole point: a chart of fading-to-yellow green candles is an uptrend losing its grip, long before the colour actually flips.
How to Read the Indicator
- Colour is direction. Green family = uptrend, red/magenta family = downtrend, grey = no committed trend. The indicator stays grey until three aligned swings build a wave, so grey stretches are genuinely structureless, not just indecisive.
- Saturation is conviction. Bright green / saturated red means price is at the strong end of its wave band. Faded green-to-yellow, or red-to-magenta, means price has retraced toward the invalidation level — the trend is intact but weakening.
- Watch for the fade before the flip. Because the colour is a gradient, an uptrend that drains from green to yellow is your early warning that price is approaching
waveUpLow. A flip to the red family confirms the break after the fact; the fade hints at it first. - Grey is information too. A run of grey candles says structure has not yet organised into a wave — a poor environment for trend-following entries and a reasonable cue to stand aside.
Practical Applications
- Structural trend filter. Use the committed trend state as a directional gate for a system: take longs only while candles are in the green family, shorts only while in the red/magenta family, and stand down on grey. Because the state needs three aligned swings, it is far steadier than a moving-average filter.
- Invalidation levels for stops. The wave pivot —
waveUpLowfor longs,waveDownHighfor shorts — is a natural structural stop. A close back through it is exactly what turns the candle colour over, so the chart and the risk level agree by construction. - Exhaustion read. Treat the colour fade as a momentum gauge within the trend: scale out or tighten stops as green decays toward yellow rather than waiting for the full reversal.
- Regime detection. The grey/colour ratio over a window is a quick read on whether an instrument is trending or chopping — useful for switching between trend and mean-reversion playbooks.
Indicator Configuration
nZigzag(default 2): the number of bars on each side of a fractal swing. The default of 2 (a five-bar window) is responsive and well suited to intraday charts, but it produces many swings. On daily or weekly timeframes, raise it to 4–5 for cleaner, more significant waves and less noise.
The gradient colours are defined as plain RGB constants at the top of the code (upStart/upEnd for the uptrend ramp, downStart/downEnd for the downtrend ramp). Edit those values to recolour the indicator to taste — for example, swap the yellow→green ramp for a single-hue fade if you prefer a more subdued look.
Code
//-----------------------------------------------------
//PRC_PhantomFlow TrendDetector
//version = 0
//11.05.2026
//Ivan Gonzalez @ www.prorealcode.com
//Sharing ProRealTime knowledge
// Original: PhantomFlow_s666ex_ (TradingView, MPL 2.0)
//-----------------------------------------------------
// === Inputs ===
//-----------------------------------------------------
nZigzag = 2

// Up Trend gradient (low -> high)
upStartR = 255
upStartG = 253
upStartB = 106
upEndR = 0
upEndG = 255
upEndB = 0

// Down Trend gradient (low -> high)
downStartR = 255
downStartG = 89
downStartB = 255
downEndR = 255
downEndG = 0
downEndB = 0
//-----------------------------------------------------
// === Inicializacion (primera barra) ===
//-----------------------------------------------------
IF barindex = 0 THEN
   fracUp1 = 0
   fracUp2 = 0
   fracUp3 = 0
   fracDown1 = 0
   fracDown2 = 0
   fracDown3 = 0
   numUp = 0
   numDown = 0
   isLastUp = -1
   waveUpStart = 0
   waveUpEnd = 0
   waveUpHigh = 0
   waveUpLow = 0
   hasWaveUp = 0
   waveDownStart = 0
   waveDownEnd = 0
   waveDownHigh = 0
   waveDownLow = 0
   hasWaveDown = 0
   lastLow = 0
   lastHigh = 0
ENDIF

addUpWave = 0
addDownWave = 0
//-----------------------------------------------------
// === Deteccion de fractales ===
// (simetricos n=2, ventana = 5 barras)
//-----------------------------------------------------
canSearchFractal = barindex >= 2 * nZigzag

IF canSearchFractal THEN
   // Fractal up: high[2] es maximo de high[0..4]
   IF high[nZigzag] = highest[2 * nZigzag + 1](high) THEN
      isUpFractal = 1
   ELSE
      isUpFractal = 0
   ENDIF
   // Fractal down: low[2] es minimo de low[0..4]
   IF low[nZigzag] = lowest[2 * nZigzag + 1](low) THEN
      isDownFractal = 1
   ELSE
      isDownFractal = 0
   ENDIF

   barFrac = barindex - nZigzag
   priceUpFrac = high[nZigzag]
   priceDownFrac = low[nZigzag]

   // --- Procesar fractal up ---
   IF isUpFractal = 1 THEN
      IF numUp = 0 AND numDown = 0 THEN
         fracUp1 = barFrac
         numUp = 1
         isLastUp = 1
      ELSE
         IF isLastUp = 1 THEN
            // Ultimo era up: si el nuevo es mas alto, reemplazar (pop + push)
            IF high[barindex - fracUp1] < priceUpFrac THEN
               fracUp1 = barFrac
               addUpWave = 1
            ENDIF
         ELSE
            // Ultimo era down: confirmar zigzag si new high > last down low
            IF low[barindex - fracDown1] < priceUpFrac THEN
               fracUp3 = fracUp2
               fracUp2 = fracUp1
               fracUp1 = barFrac
               numUp = numUp + 1
               isLastUp = 1
               addUpWave = 1
            ENDIF
         ENDIF
      ENDIF
   ENDIF

   // Check is_add_up_liquidity: 3 ups consecutivos con highs decrecientes
   IF addUpWave = 1 AND numUp >= 3 THEN
      h1 = high[barindex - fracUp1]
      h2 = high[barindex - fracUp2]
      h3 = high[barindex - fracUp3]
      IF h1 < h2 AND h2 < h3 THEN
         IF hasWaveUp = 1 AND fracUp3 >= waveUpStart AND fracUp3 < waveUpEnd THEN
            // Extender wave
            waveUpEnd = fracUp1
            waveUpLow = h1
         ELSE
            // Nueva wave
            waveUpStart = fracUp3
            waveUpEnd = fracUp1
            waveUpHigh = h3
            waveUpLow = h1
         ENDIF
         hasWaveUp = 1
      ENDIF
   ENDIF

   // --- Procesar fractal down ---
   IF isDownFractal = 1 THEN
      IF numDown = 0 AND numUp = 0 THEN
         fracDown1 = barFrac
         numDown = 1
         isLastUp = 0
      ELSE
         IF isLastUp = 0 THEN
            // Ultimo era down: si el nuevo es mas bajo, reemplazar
            IF low[barindex - fracDown1] > priceDownFrac THEN
               fracDown1 = barFrac
               addDownWave = 1
            ENDIF
         ELSE
            // Ultimo era up: confirmar zigzag si last up high > new down low
            IF high[barindex - fracUp1] > priceDownFrac THEN
               fracDown3 = fracDown2
               fracDown2 = fracDown1
               fracDown1 = barFrac
               numDown = numDown + 1
               isLastUp = 0
               addDownWave = 1
            ENDIF
         ENDIF
      ENDIF
   ENDIF

   // Check is_add_down_liquidity: 3 downs consecutivos con lows crecientes
   IF addDownWave = 1 AND numDown >= 3 THEN
      l1 = low[barindex - fracDown1]
      l2 = low[barindex - fracDown2]
      l3 = low[barindex - fracDown3]
      IF l1 > l2 AND l2 > l3 THEN
         IF hasWaveDown = 1 AND fracDown3 >= waveDownStart AND fracDown3 < waveDownEnd THEN
            // Extender wave
            waveDownEnd = fracDown1
            waveDownHigh = l1
         ELSE
            // Nueva wave
            waveDownStart = fracDown3
            waveDownEnd = fracDown1
            waveDownLow = l3
            waveDownHigh = l1
         ENDIF
         hasWaveDown = 1
      ENDIF
   ENDIF
ENDIF
//-----------------------------------------------------
// === Determinar tendencia ===
//-----------------------------------------------------
isUpTrend = 0
isDownTrend = 0

IF hasWaveUp = 1 AND hasWaveDown = 1 THEN
   IF close < waveDownHigh AND close > waveUpLow THEN
      IF waveDownEnd < waveUpEnd THEN
         isUpTrend = 1
         lastLow = waveUpLow
         lastHigh = waveUpHigh
      ELSE
         isDownTrend = 1
         lastLow = waveDownLow
         lastHigh = waveDownHigh
      ENDIF
   ENDIF
   IF close >= waveDownHigh AND close > waveUpLow THEN
      isUpTrend = 1
      lastLow = waveUpLow
      lastHigh = waveUpHigh
   ENDIF
   IF close < waveDownHigh AND close <= waveUpLow THEN
      isDownTrend = 1
      lastLow = waveDownLow
      lastHigh = waveDownHigh
   ENDIF
ENDIF

IF hasWaveUp = 1 AND hasWaveDown = 0 THEN
   IF close > waveUpLow THEN
      isUpTrend = 1
      lastLow = waveUpLow
      lastHigh = waveUpHigh
   ENDIF
ENDIF

IF hasWaveDown = 1 AND hasWaveUp = 0 THEN
   IF close < waveDownHigh THEN
      isDownTrend = 1
      lastLow = waveDownLow
      lastHigh = waveDownHigh
   ENDIF
ENDIF
//-----------------------------------------------------
// === Color gradient interpolado ===
// (signal = close, ema(1) = close)
//-----------------------------------------------------
signal = close

IF lastHigh - lastLow <= 0 THEN
   norm = 0.5
ELSE
   norm = (signal - lastLow) / (lastHigh - lastLow)
   IF norm < 0 THEN
      norm = 0
   ENDIF
   IF norm > 1 THEN
      norm = 1
   ENDIF
ENDIF

paintR = 128
paintG = 128
paintB = 128

IF isUpTrend = 1 THEN
   // Up: upStart (low) -> upEnd (high)
   paintR = ROUND(upStartR + (upEndR - upStartR) * norm)
   paintG = ROUND(upStartG + (upEndG - upStartG) * norm)
   paintB = ROUND(upStartB + (upEndB - upStartB) * norm)
ENDIF

IF isDownTrend = 1 THEN
   // Down: downEnd (low) -> downStart (high)
   paintR = ROUND(downEndR + (downStartR - downEndR) * norm)
   paintG = ROUND(downEndG + (downStartG - downEndG) * norm)
   paintB = ROUND(downEndB + (downStartB - downEndB) * norm)
ENDIF

DRAWCANDLE(open, high, low, close) COLOURED(paintR, paintG, paintB)
//-----------------------------------------------------
RETURN
