

Order-Breaker Blocks (OBB): Identifying Key Zones
Introduction
The Order-Breaker Blocks (OBB) indicator is a tool designed to identify significant areas of institutional interest on a price chart. By detecting critical zones of buying and selling pressure, it helps traders pinpoint potential reversal points and validate trend continuations. These blocks, often referred to as Order Blocks and Breaker Blocks, highlight areas where large market players, like banks or hedge funds, are likely making significant trades.
The OBB indicator aims to provide traders with an effective way to spot these areas, making it a valuable addition to any trading strategy involving price action and key support/resistance levels.
What Are Order Blocks and Breaker Blocks?
Order Blocks are areas where institutional traders have executed large orders, leaving visible footprints in the form of price consolidations or sudden price movements. These areas act as potential zones of support and resistance.
- Bullish Order Blocks: Represent buying pressure, often formed before an upward move.
- Bearish Order Blocks: Represent selling pressure, usually occurring before a downward move.
Breaker Blocks, on the other hand, signify the invalidation of a previous order block. When price breaks through an order block, it often signals a shift in market sentiment and potential trend continuation.
How the OBB Indicator Works
The OBB indicator automatically detects and plots bullish and bearish order blocks on the chart and monitors for breakouts through these zones. It uses a combination of swing highs and lows to define key points and validate breakouts, highlighting their status using different colors.
Key Parameters of the Indicator:
length: The lookback period to detect swing highs and lows.showBullandshowBear: Define how many bullish and bearish order blocks are displayed on the chart.useBody: A boolean setting to decide whether the blocks are calculated using the candle bodies (open/close) or wicks (high/low).
Calculation and Internal Logic
- Swing Detection:
- The indicator scans past bars (based on
length) to detect significant highs and lows, identifying swing points (topyfor highs,btmyfor lows). - Once a new swing is detected, the corresponding order block construction begins.
- The indicator scans past bars (based on
- Order Block Construction:
- For a bullish order block, the indicator identifies the highest and lowest price levels preceding the upward breakout.
- For a bearish order block, it tracks the key levels preceding the downward breakout.
- The blocks are stored as rectangles for easy visualization.
- Validation of Breakouts:
- The indicator checks whether price breaks through the upper or lower bounds of the order block.
- If the block is broken, it changes color to represent the breakout’s direction and significance.
- Graphical Representation:
- The blocks are drawn on the chart using
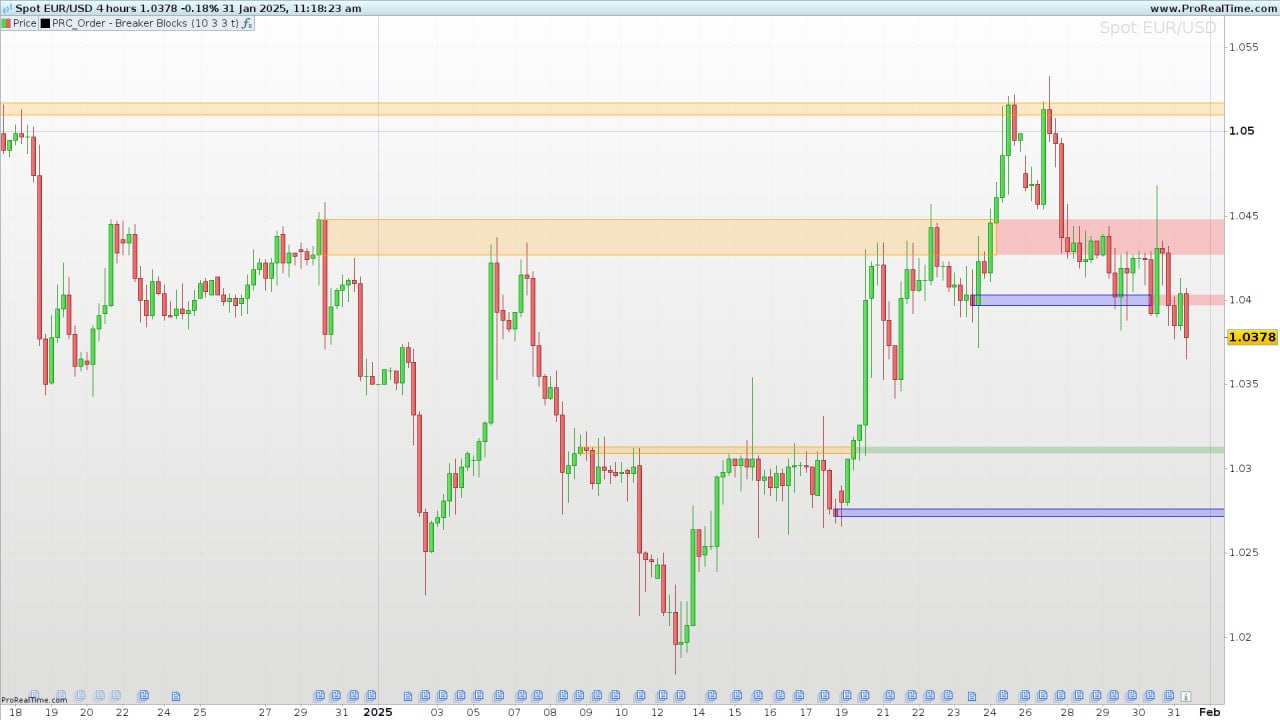
drawrectangle, with different colors indicating the block’s current status. - Colors include:
- Blue/orange: Active order blocks.
- Green: Bullish breakout.
- Red: Bearish breakout.
- Yellow: Uncertain state (inside the block).
- The blocks are drawn on the chart using
Indicator Customization
The OBB indicator is fully customizable, allowing traders to adapt it to various trading styles:
length: A short length (e.g., 5–10) is suitable for intraday traders, while a longer length (e.g., 20–50) may benefit swing traders.showBullandshowBear: Adjust these parameters to control how many historical order blocks are displayed.useBody: Enable this option for more conservative setups by focusing on candle bodies instead of wicks.
Trading Strategies Using the OBB Indicator
- Reversal Trades:
- Look for price rejection at a bullish or bearish order block, confirming the zone’s validity as support or resistance.
- Enter trades in the direction of the reversal with a stop loss placed just outside the block.
- Breakout Continuation:
- Use breakouts through order blocks as signals of a potential trend continuation.
- For bullish breakouts, consider long positions, and for bearish breakouts, short positions may be appropriate.
Advantages and Limitations of the OBB Indicator
Advantages:
- Identifies key zones of price action that reflect institutional interest.
- Visually clear and intuitive representation of support and resistance.
- Helps distinguish between valid and invalid breakouts.
Limitations:
- The effectiveness can be sensitive to the chosen
lengthparameter. - Requires additional validation with other indicators (e.g., volume, trend filters).
ProBuilder Code for the OBB Indicator
//---------------------------------------------------------//
//PRC_Order Blocks and Breaker Blocks
//version = 0
//30.09.2024
//Iván González @ www.prorealcode.com
//Sharing ProRealTime knowledge
//---------------------------------------------------------//
//-----Inputs----------------------------------------------//
//---------------------------------------------------------//
length=10 //Swing Lookback
showBull=5 //Show last bullish OB
showBear=5 //Show last bearish OB
useBody=0
//---------------------------------------------------------//
//-----Detect Swings---------------------------------------//
//---------------------------------------------------------//
n=barindex
once os=0
upper=highest[length](high)
lower=lowest[length](low)

if high[length]>upper then
os=0
elsif low[length]<lower then
os=1
else
os=os
endif

if os=0 and os[1]<>0 then
topy=high[length]
topx=barindex[length]
topcrossed=0
elsif os=1 and os[1]<>1 then
btmy=low[length]
btmx=barindex[length]
btmcrossed=0
endif

if usebody then
mimax=max(close,open)
mimin=min(close,open)
else
mimax=high
mimin=low
endif

//---------------------------------------------------------//
//-----Bullish OB------------------------------------------//
//---------------------------------------------------------//
if close > topy and topcrossed=0 then

topcrossed=1

minima=mimax[1]
maxima=mimin[1]
loc=barindex[1]

for i=1 to (n-topx)-1 do
minima=min(mimin[i],minima)
if minima=mimin[i] then
maxima=mimax[i]
loc=barindex[i]
else
maxima=maxima
loc=loc
endif
next

$bullTop[m+1]=maxima
$bullBtm[m+1]=minima
$bullx[m+1]=loc
$bullbreak[m+1]=0
m=m+1
endif

//---------------------------------------------------------//
//-----Bearish OB------------------------------------------//
//---------------------------------------------------------//
bearBreakConf=0
if close < btmy and btmcrossed=0 then

btmcrossed=1

minima2=mimin[1]
maxima2=mimax[1]
loc2=barindex[1]

for i=1 to (n-btmx)-1 do
maxima2=max(mimax[i],maxima2)
if maxima2=mimax[i] then
minima2=mimin[i]
loc2=barindex[i]
else
minima2=minima2
loc2=loc2
endif
next

$bearTop[z+1]=maxima2
$bearBtm[z+1]=minima2
$bearx[z+1]=loc2
$bearbreak[z+1]=0
z=z+1
endif

//---------------------------------------------------------//
//-----Plot Order Blocks-----------------------------------//
//---------------------------------------------------------//
if islastbarupdate then

for i=m downto 1 do
for j=barindex downto 0 do
if barindex[j]>$bullx[i] and close[j] < $bullBtm[i] then
$bullright[i]=barindex[j]
$bullbreak[i]=1
break
else
$bullright[i]=barindex
endif
next
if i>m-showbull then
if $bullbreak[i]=0 then
drawrectangle($bullx[i],$bullBtm[i],$bullright[i]+20,$bullTop[i])coloured("blue")fillcolor("blue",50)
elsif $bullbreak[i]=1 then
drawrectangle($bullx[i],$bullBtm[i],$bullright[i],$bullTop[i])coloured("blue")fillcolor("blue",50)
if close>$bullTop[i]then
drawrectangle($bullright[i],$bullBtm[i],barindex+20,$bullTop[i])coloured("green",0)fillcolor("green",50)
elsif close<$bullBtm[i]then
drawrectangle($bullright[i],$bullBtm[i],barindex+20,$bullTop[i])coloured("red",0)fillcolor("red",50)
else
drawrectangle($bullright[i],$bullBtm[i],barindex+20,$bullTop[i])coloured("yellow",0)fillcolor("yellow",50)
endif
endif
endif
next

for i=z downto 1 do
for j=barindex downto 0 do
if barindex[j]>$bearx[i] and close[j] > $bearTop[i] then
$bearright[i]=barindex[j]
$bearbreak[i]=1
break
else
$bearright[i]=barindex
endif
next
if i>z-showbear then
if $bearbreak[i]=0 then
drawrectangle($bearx[i],$bearBtm[i],$bearright[i]+20,$bearTop[i])coloured("orange")fillcolor("orange",50)
elsif $bearbreak[i]=1 then
drawrectangle($bearx[i],$bearBtm[i],$bearright[i],$bearTop[i])coloured("orange")fillcolor("orange",50)
if close>$bearTop[i]then
drawrectangle($bearright[i],$bearBtm[i],barindex+20,$bearTop[i])coloured("green",0)fillcolor("green",50)
elsif close<$bearBtm[i]then
drawrectangle($bearright[i],$bearBtm[i],barindex+20,$bearTop[i])coloured("red",0)fillcolor("red",50)
else
drawrectangle($bearright[i],$bearBtm[i],barindex+20,$bearTop[i])coloured("yellow",0)fillcolor("yellow",50)
endif
endif
endif
next
endif

return
Conclusion
The Order-Breaker Blocks (OBB) indicator provides traders with a systematic approach to identifying and validating key zones of institutional buying and selling. By combining order blocks and breaker blocks with customizable parameters, traders can better interpret market movements and optimize their trading strategies. As always, it is recommended to test the indicator in simulated environments before applying it in live trading.
