

Open High Low Close Volume and Variation% Dashboard
February 16, 2024, 9:54 AM
Indicators
0 Comments
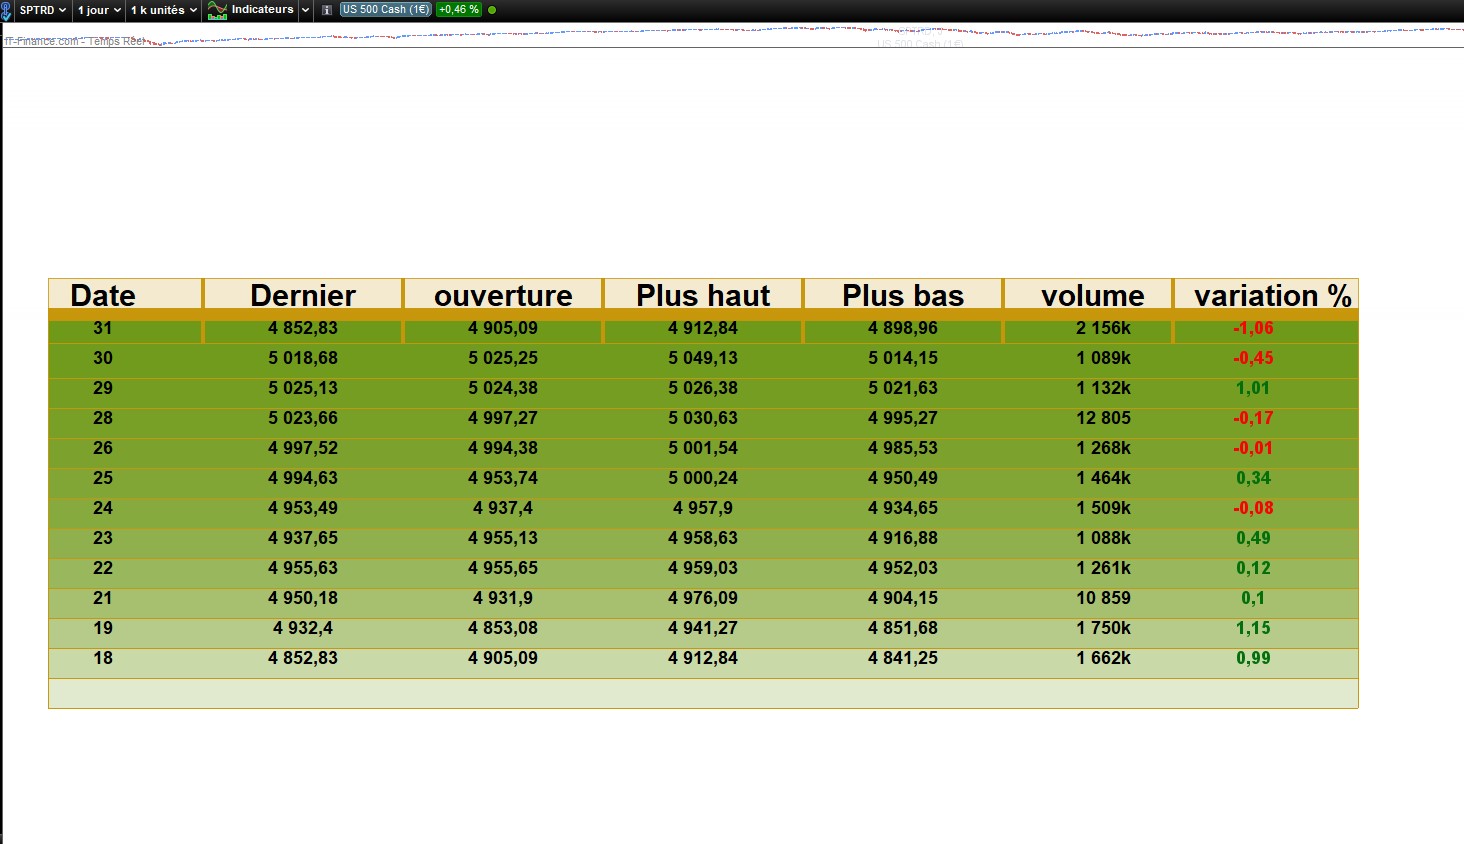
The code fetch the opening, highest, lowest, and closing prices of the selected instrument for the “Nb” previous days.
The dashboard will calculate the percentage change in the instrument’s closing price compared to the previous day’s close.
Values are displayed as a dashboard on your chart, adapt the way it is displayed by moving it with X and Y coordinates in pixels.
defparam drawonlastbaronly=true

// ----settings------
Start=20240131
Alpha=50
X=1
Y=1
Nb=5 //days quantity
// ------------------

NbDeJour =nb// Nombre de jours à ajouter
timeframe(daily)
if opendate=start  then
d1=Openday
mm1=Openmonth
y1=OpenYear
startbar=barindex
dernier=close
ouverture=open
PlusHaut=high
plusBas=low
for j=1 to Nb do
$d2[j]=Openday[j-1]
$v[j]=volume[j-1]
$variation1[j]=(round(Variation(close[j-1]),2))
next
endif
timeframe(default)
// Calcul pour ajouter NbDeJour à la barre de début

// Dessine une ligne verticale à la nouvelle date
DRAWVLINE(startbar)

drawrectangle(X-205,50+Y,1105+X,15+Y)anchor(bottomleft)coloured(100,150,10,alpha)bordercolor(200,150,10,250)
drawrectangle(X-205,80+Y,1105+X,50+Y)anchor(bottomleft)coloured(200,150,10,alpha)bordercolor(200,150,10,200)
drawsegment(x-50,80+Y,x-50,15+Y)anchor(bottomleft)coloured(200,150,10,250)style(line,4)
drawsegment(150+x,80+Y,150+X,15+Y)anchor(bottomleft)coloured(200,150,10,250)style(line,4)
drawsegment(350+x,80+Y,350+X,15+Y)anchor(bottomleft)coloured(200,150,10,250)style(line,4)
drawsegment(550+x,80+Y,550+X,15+Y)anchor(bottomleft)coloured(200,150,10,250)style(line,4)
drawsegment(750+x,80+Y,750+X,15+Y)anchor(bottomleft)coloured(200,150,10,250)style(line,4)
drawsegment(920+x,80+Y,920+X,15+Y)anchor(bottomleft)coloured(200,150,10,250)style(line,4)
//DRAWTEXT("  #d1#/#mm1#/ #y1#", x-150, 30+y,Dialog,Bold,18) anchor(bottomleft)
drawtext ("Date", x-150 ,60+y,Dialog,Bold,30) anchor(bottomleft)
drawtext ("Dernier", 50+x ,60+y,Dialog,Bold,30) anchor(bottomleft)
drawtext ("ouverture", 250+x ,60+y,Dialog,Bold,30) anchor(bottomleft)
drawtext ("Plus haut", 450+x ,60+y,Dialog,Bold,30) anchor(bottomleft)
drawtext ("Plus bas", 650+x ,60+y,Dialog,Bold,30) anchor(bottomleft)
drawtext ("volume", 840+x ,60+y,Dialog,Bold,30) anchor(bottomleft)
drawtext ("variation %", 1020+x ,60+y,Dialog,Bold,30) anchor(bottomleft)


dist=60
dist1=10
dist2=30
d2=1
der=0
startbarPlusNbDeJour = startbar + NbDeJour
for i=1 TO  nb do
if i=1 then
der=dernier
ouv=ouverture
hh=PlusHaut

ELSE
der=dclose(i)
ouv=dopen(i)
hh=dhigh(i)
ll=dlow(i)


endif
if $variation1[i]<0 THEN

r=250
b=0
g=0
ELSE

r=0
b=110
g=10
endif
startbar1 =barindex+i

//mm1=Openmonth
//y1=OpenYear
dist=dist-30
dist1=dist1-30
dist2=dist2-1


DRAWTEXT(der, 50+x, y+dist,Dialog,Bold,18) anchor(bottomleft)
DRAWTEXT(ouv, 250+x, y+dist,Dialog,Bold,18) anchor(bottomleft)
DRAWTEXT(hh, 450+x, y+dist,Dialog,Bold,18) anchor(bottomleft)
DRAWTEXT(ll, 650+x, y+dist,Dialog,Bold,18) anchor(bottomleft)
DRAWTEXT($v[i], 850+x, y+dist,Dialog,Bold,18) anchor(bottomleft)
DRAWTEXT($variation1[i], 1000+x, y+dist,Dialog,Bold,18) anchor(bottomleft)coloured(r,b,g,250)
DRAWTEXT($d2[i], x-150, y+dist,Dialog,Bold,18) anchor(bottomleft)
drawrectangle(X-205,Y+dist1,1105+X,20+Y+dist2)anchor(bottomleft)coloured(100,150,10,alpha)bordercolor(200,150,10,250)

next
return
Download
Filename:
tableau-hh-ll-v.itf
Downloads:
47
Senior
I usually let my code do the talking, which explains why my bio is as empty as a newly created file. Bio to be initialized...
Author’s Profile
Loading...