

OnChart Stochastic
May 23, 2018, 1:54 PM
Indicators
10 Comments
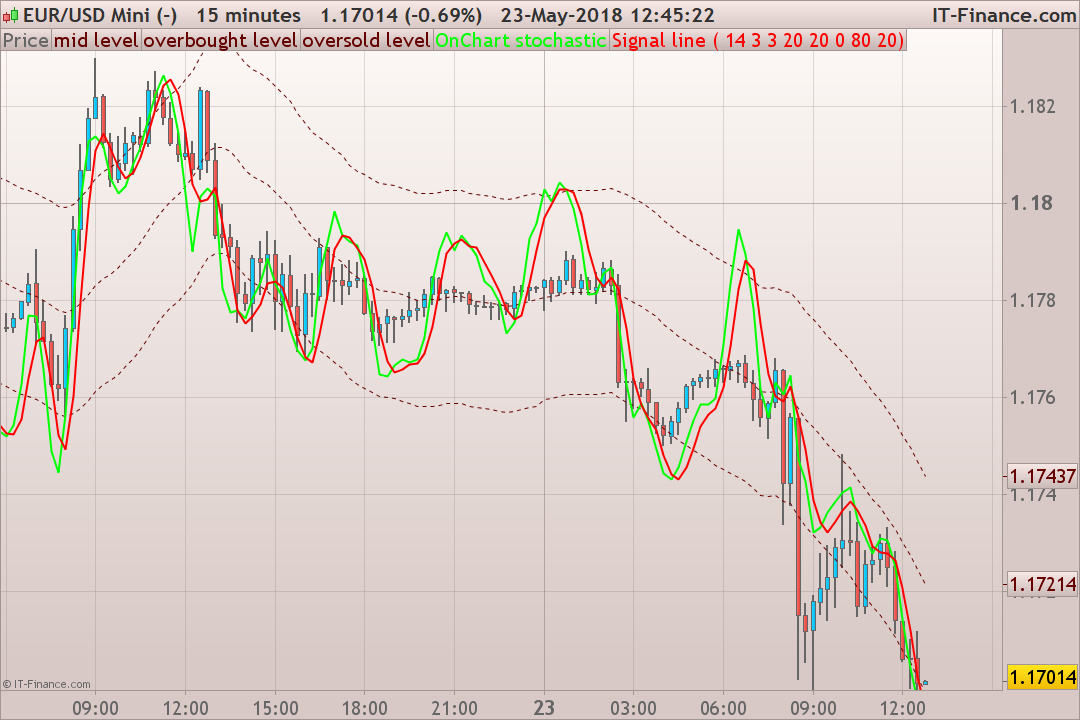
The “onChart Stochastic” indicator plots a stochastic oscillator directly overlaid on the price chart.
The price range of the stochastic is calculated with the daily Average True Range of the last 20 periods (days).
This price range is then applied centered over a moving average on price. Consequently, the overbought and oversold levels are the upper and lower bands of the channel. By using this kind of approach, any bounded oscillator could be applied on the price chart, like the way this indicator does (RSI, CCI, etc.).
Converted from a MT4 indicator by a request in the English forum.
//PRC_OnChart Stochastic | indicator
//23.05.2018
//Nicolas @ www.prorealcode.com
//Sharing ProRealTime knowledge

// --- settings
KPeriod = 26
Slowing = 5
DPeriod = 5
ATRperiod = 20
maPeriod = 20
maMethod = 0
overBought = 80
overSold = 20
// --- end of settings

maPrice = customclose

dTR = 0
for i = 0 to ATRperiod-1
 dTR=dTR+max(abs(Dhigh(i)-Dlow(i)),max(abs(Dhigh(i)-Dclose(i+1)),abs(Dlow(i)-Dclose(i+1))))
next

avgRange = dTR/ATRperiod
maValue = average[maPeriod,maMethod](maPrice)
stochValue = Stochastic[Kperiod,Slowing](maPrice)
signalValue = average[Dperiod,maMethod](stochValue)
//----
Buffer1=maValue
Buffer2=maValue+(avgRange*(overBought-50)/100)
Buffer3=maValue-(avgRange*(50-  overSold)/100)
Buffer4=maValue+(stochValue -50)/100*avgRange
Buffer5=maValue+(signalValue-50)/100*avgRange

return Buffer1 coloured(102,0,0) style(dottedline,1) as "mid level", Buffer2 coloured(102,0,0) style(dottedline,1) as "overbought level", Buffer3 coloured(102,0,0) style(dottedline,1) as "oversold level", Buffer4 coloured(0,255,0) style(line,2) as "OnChart stochastic", Buffer5 coloured(255,0,0) style(line,2) as "Signal line"
Download
Filename:
PRC_OnChart-Stochastic-1.itf
Downloads:
431
Master
I created ProRealCode because I believe in the power of shared knowledge. I spend my time coding new tools and helping members solve complex problems.
If you are stuck on a code or need a fresh perspective on a strategy, I am always willing to help. Welcome to the community!
Author’s Profile
Loading...