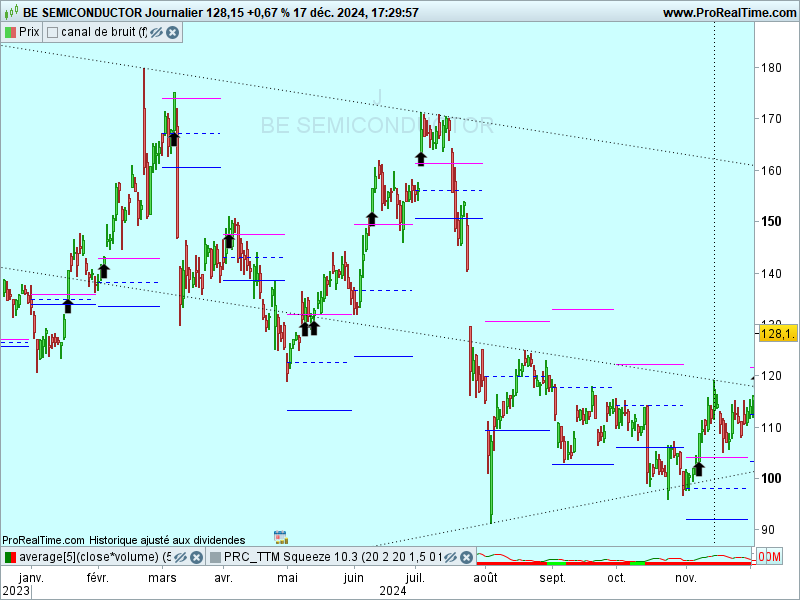
This indicator is particularly valuable for quickly assessing whether the market is bullish (above noise), bearish (below noise) or in a range phase (when prices oscillate without a clear direction).
At a glance, it enables you to adapt your strategy: a trending market will encourage you to favour entries in the direction of the movement, while a range market is more likely to encourage you to exploit turning points. The enormous advantage of this indicator also lies in its versatility, as combining it with several time units enriches the analysis. By observing signals over different timeframes, we can better anticipate future movements and confirm the breaking of important levels (thanks to Prunus Dulcis).
|
1 2 3 4 5 6 7 8 9 10 11 12 13 14 15 16 17 18 19 20 21 22 23 24 25 26 27 28 29 30 31 32 33 34 35 36 37 38 39 40 41 42 43 44 45 46 47 48 49 50 51 52 53 54 55 56 57 58 59 60 61 62 63 64 65 66 67 68 69 70 71 72 73 74 75 76 77 78 79 80 81 82 83 84 85 86 87 88 89 90 91 92 93 94 95 96 97 98 99 100 |
DEFPARAM CALCULATEONLASTBARS = 300 //paramètre// showhigh=0 ////////////////// timeframe(monthly) c1=open if (high[1]-c1[1] )< (c1[1] - low[1]) then c21=high[1]-c1[1] endif if (high[1]-c1[1])>=(c1[1] - low[1]) then c21=c1[1] -low[1] endif if (high[2]-c1[2] )< (c1[2] - low[2]) then c22=high[2]-c1[2] endif if (high[2]-c1[2]) >=(c1[2] - low[2]) then c22=c1[2] -low[2] endif if (high[3]-c1[3] )< (c1[3] - low[3]) then c23=high[3]-c1[3] endif if (high[3]-c1[3]) >=(c1[3] - low[3]) then c23=high[3] -low[3] endif if (high[4]-c1[4] )< (c1[4] - low[4]) then c24=c1[4]-c1[4] endif if (high[4]-c1[4]) >=(c1[4] - low[4]) then c24=high[4] -low[4] endif if (high[5]-c1[5] )< (c1[5] - low[5]) then c25=high[5]-c1[5] endif if (high[5]-c1[5]) >=(c1[5] - low[5]) then c25=c1[5] -low[5] endif if (high[6]-c1[6] )< (c1[6] - low[6]) then c26=high[6]-c1[6] endif if (high[6]-c1[6]) >=(c1[6] - low[6]) then c26=high[6] -low[6] endif if (high[7]-c1[7] )< (c1[7] - low[7]) then c27=c1[7]-c1[7] endif if (high[7]-c1[7]) >=(c1[7] - low[7]) then c27=high[7] -low[7] endif if (high[8]-c1[8] )< (c1[8] - low[8]) then c28=high[8]-c1[8] endif if (high[8]-c1[8] )>=(c1[8] - low[8]) then c28=c1[8] -low[8] endif if (high[9]-c1[9] )< (c1[9] - low[9]) then c29=high[9]-c1[9] endif if (high[9]-c1[9] )>=(c1[9] - low[9]) then c29=c1[9] -low[9] endif if (high[10]-c1[10] )< (c1[10] - low[10]) then c30=high[10]-c1[10] endif if (high[10]-c1[10] )>=(c1[10] - low[10]) then c30=c1[10] -low[10] endif somme=c21+c22+c23+c24+c25+c26+c27+c28+c29+c30 c3=somme/10 canalhaut=c1+c3 canalbas=c1-c3 timeframe(daily) if month <> month[1] then debutmois = barindex endif if showhigh then ////ONCE MONTH//// once currenthighmonth=high once currentlowmonth=low once previoushighmonth=undefined once previouslowmonth=undefined ///OPEN MONTH//// if openmonth<>openmonth[1] then debutmois=barindex previoushighmonth=currenthighmonth previouslowmonth=currentlowmonth currenthighmonth=high currentlowmonth=low DRAWSEGMENT(debutmois-1,previoushighmonth, debutmois-21,previoushighmonth) else currenthighmonth=max(high,currenthighmonth) currentlowmonth=min(low,currentlowmonth) endif endif drawsegment(debutmois,c1, barindex, c1) coloured(0,0,255) style(dottedline,1) drawsegment(debutmois,canalhaut, barindex, canalhaut) coloured(255,0,255) style(line,1) drawsegment(debutmois,canalbas, barindex, canalbas) coloured(0,0,255) style(line,1) if close>canalhaut and close[1]<=canalhaut then drawARROWUP(barindex,low) endif return |
Share this
No information on this site is investment advice or a solicitation to buy or sell any financial instrument. Past performance is not indicative of future results. Trading may expose you to risk of loss greater than your deposits and is only suitable for experienced investors who have sufficient financial means to bear such risk.
ProRealTime ITF files and other attachments :
Find other exclusive trading pro-tools on ![]()
PRC is also on YouTube, subscribe to our channel for exclusive content and tutorials


à utiliser en unité de temps jour
Pourrait-on créer un screener sur la base de cet indicateur, dont l’idée semble très pertinente ?
le voici (détecte le croisement bande haute ou bande basse) :
timeframe(monthly)
c1=open
if (high[1]-c1[1] )=(c1[1] – low[1]) then
c21=c1[1] -low[1]
endif
if (high[2]-c1[2] )=(c1[2] – low[2]) then
c22=c1[2] -low[2]
endif
if (high[3]-c1[3] )=(c1[3] – low[3]) then
c23=high[3] -low[3]
endif
if (high[4]-c1[4] )=(c1[4] – low[4]) then
c24=high[4] -low[4]
endif
if (high[5]-c1[5] )=(c1[5] – low[5]) then
c25=c1[5] -low[5]
endif
if (high[6]-c1[6] )=(c1[6] – low[6]) then
c26=high[6] -low[6]
endif
if (high[7]-c1[7] )=(c1[7] – low[7]) then
c27=high[7] -low[7]
endif
if (high[8]-c1[8] )=(c1[8] – low[8]) then
c28=c1[8] -low[8]
endif
if (high[9]-c1[9] )=(c1[9] – low[9]) then
c29=c1[9] -low[9]
endif
if (high[10]-c1[10] )=(c1[10] – low[10]) then
c30=c1[10] -low[10]
endif
somme=c21+c22+c23+c24+c25+c26+c27+c28+c29+c30
c3=somme/10
canalhaut=c1+c3
canalbas=c1-c3
timeframe(daily)
F=close>canalhaut and close[1]<=canalhaut
bandehaute=0
if F then
bandehaute=1
endif
G=close=canalbas
bandebasse=0
if G then
bandebasse=1
endif
screener[F or G](bandehaute as “croise bande haute”,bandebasse as “croise bande basse”)