

Nadaraya-Watson Envelope Non Repaint version
August 29, 2023, 2:16 PM
Indicators
0 Comments
This indicator builds upon the previously posted Nadaraya-Watson smoothers. Here we have created an envelope indicator based on Kernel Smoothing.
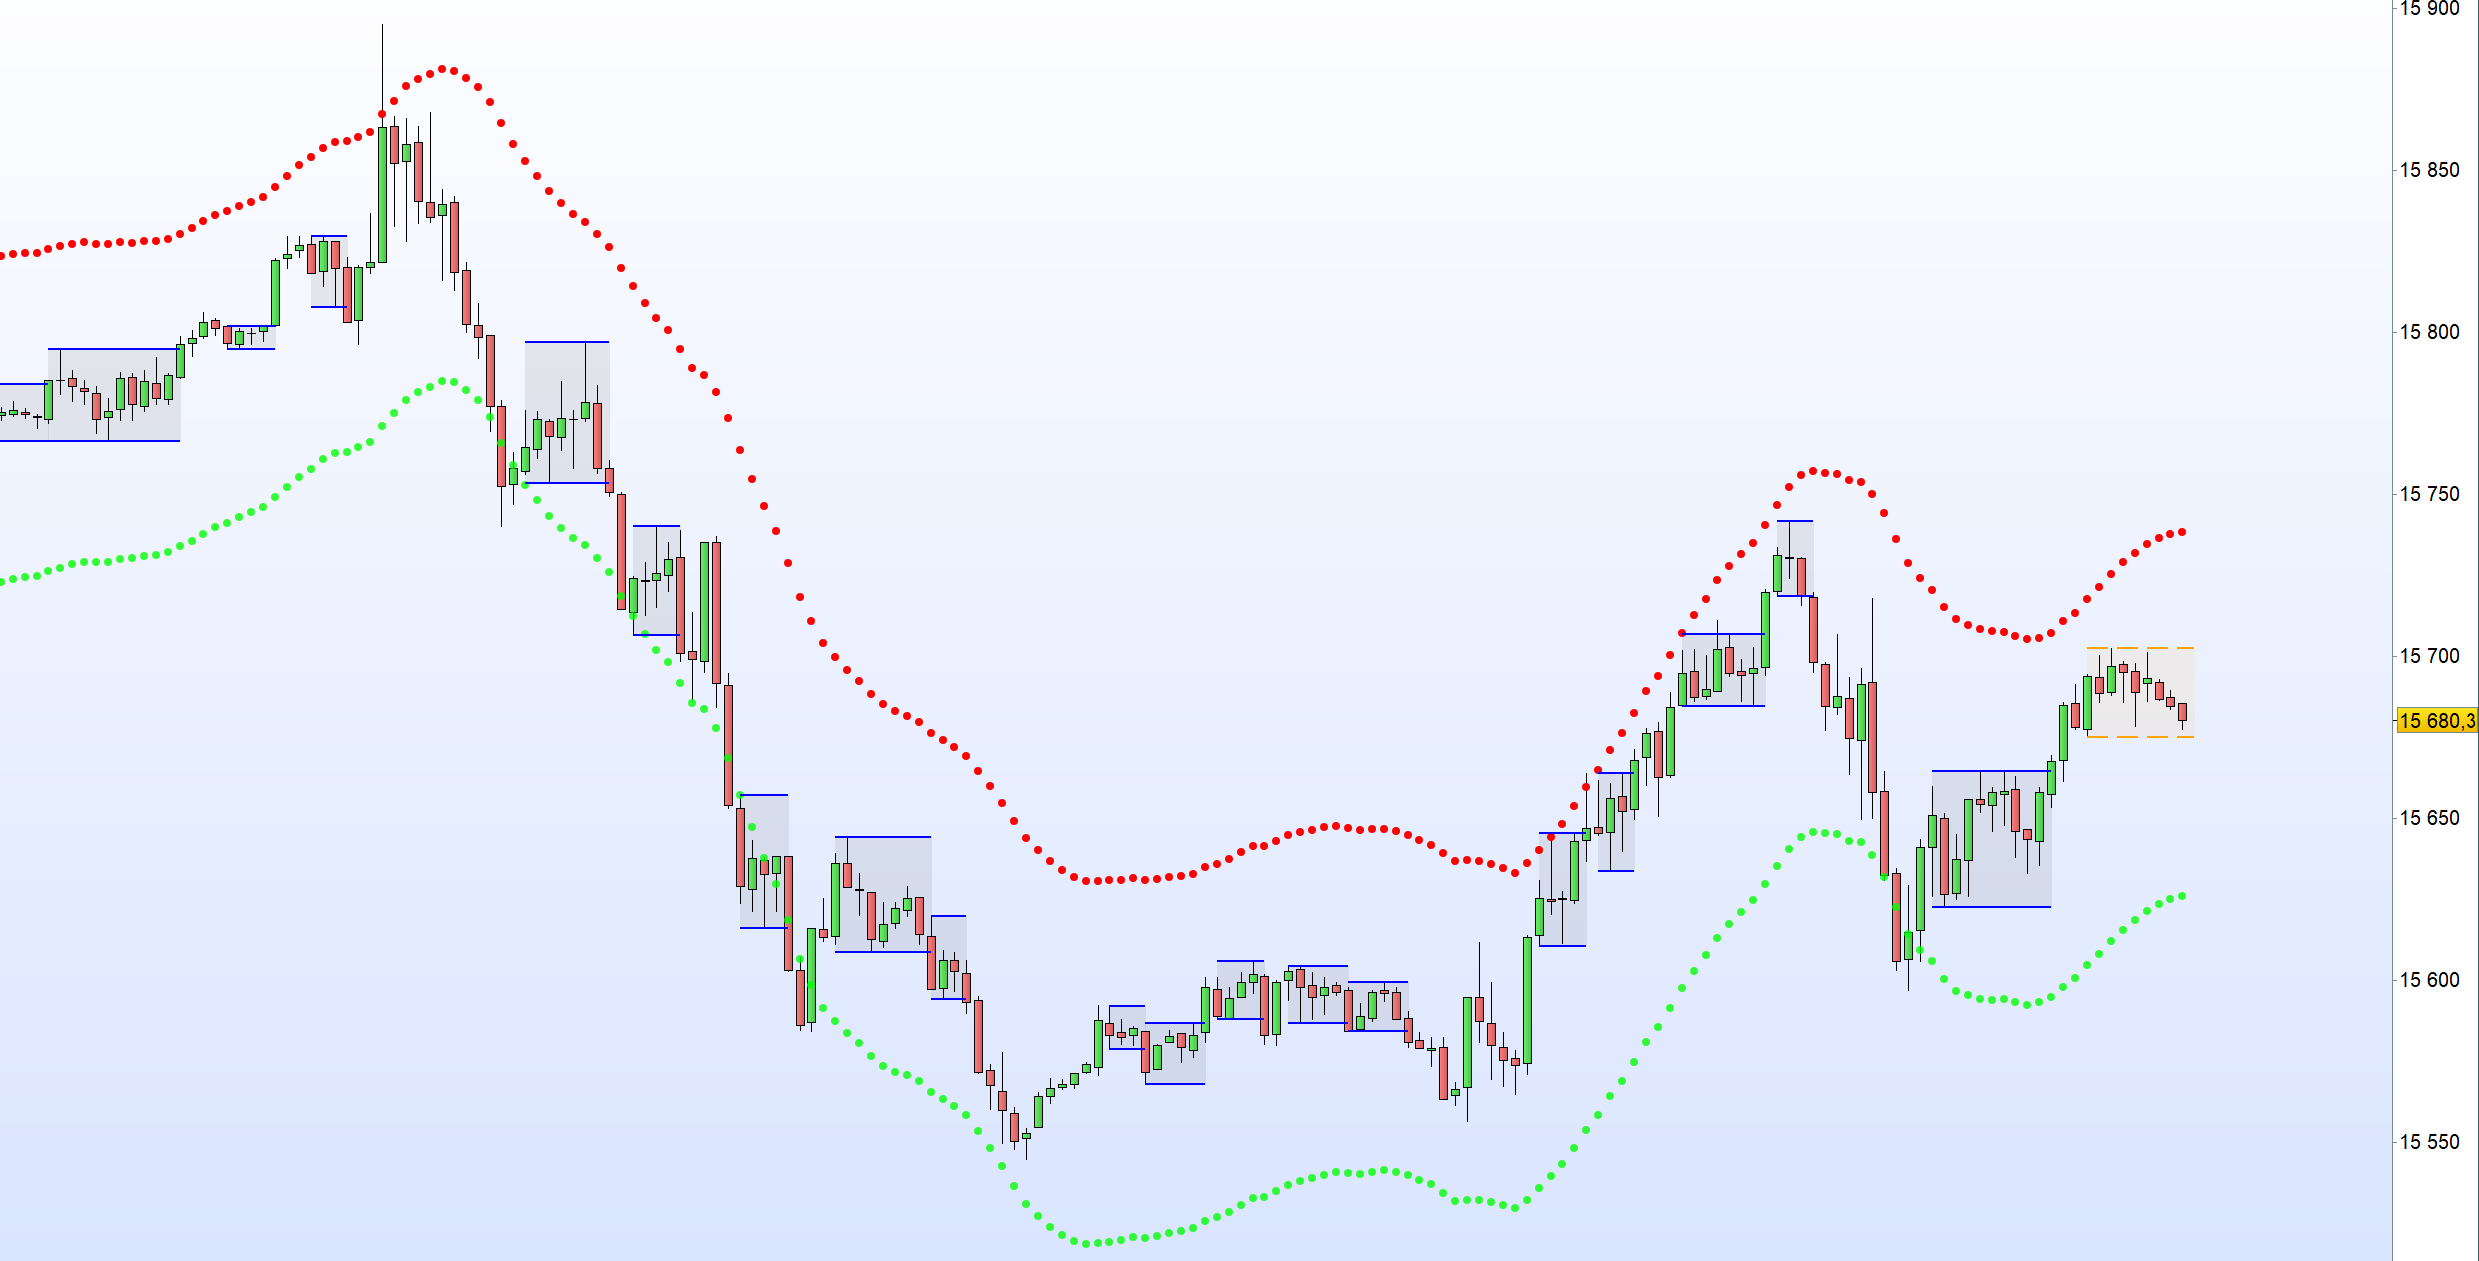
This tool can outline extremes made by the prices. This is achieved by estimating the underlying trend in the price, then calculating the mean absolute deviations from it, the obtained result is added/subtracted to the estimated underlying trend.
The non-repainting method estimates the underlying trend in price using an “endpoint Nadaraya-Watson estimator”, and would return similar results to more classical band indicators.
//Nadaraya-Watson Envelope
length = 21 //Window Size
hh = 8 //Bandwidth
mult = 2

once init = 1

src = customclose

n = barindex

If init = 1 then
den = 0
For i = 0 to length-1 do
$coefs[i]=exp(-(i*i)/(hh*hh*2))
den = den + $coefs[i]
Next
init = 0
Endif

out = 0

For i = 0 to length-1 do
out = out + src[i]*$coefs[i]
Next

out = out/den
mae = exponentialAverage[length](abs(src-out)) * mult

upper = out + mae
lower = out - mae

DRAWPOINT(barindex, lower, 2) coloured(0,255,0,200)
DRAWPOINT(barindex, upper, 2) coloured(255,0,0,255)

Return
Download
Filename:
Nadaraya-Watson-Envelope-NRP.itf
Downloads:
199
Average
Developer by day, aspiring writer by night. Still compiling my bio... Error 404: presentation not found.
Author’s Profile
Loading...