

Multicolour Bollinger Bands - Market phases
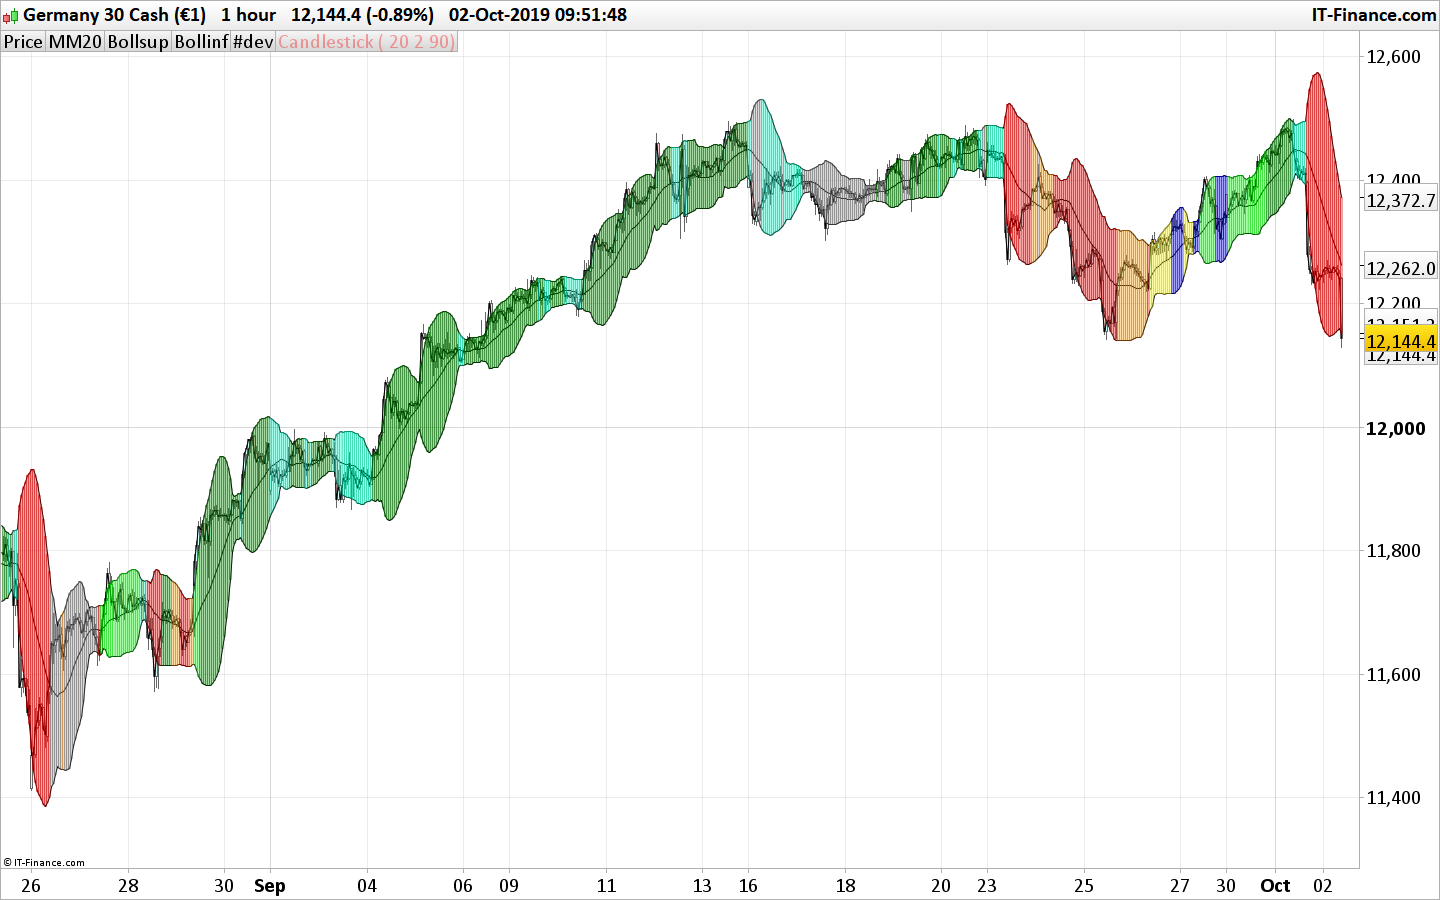
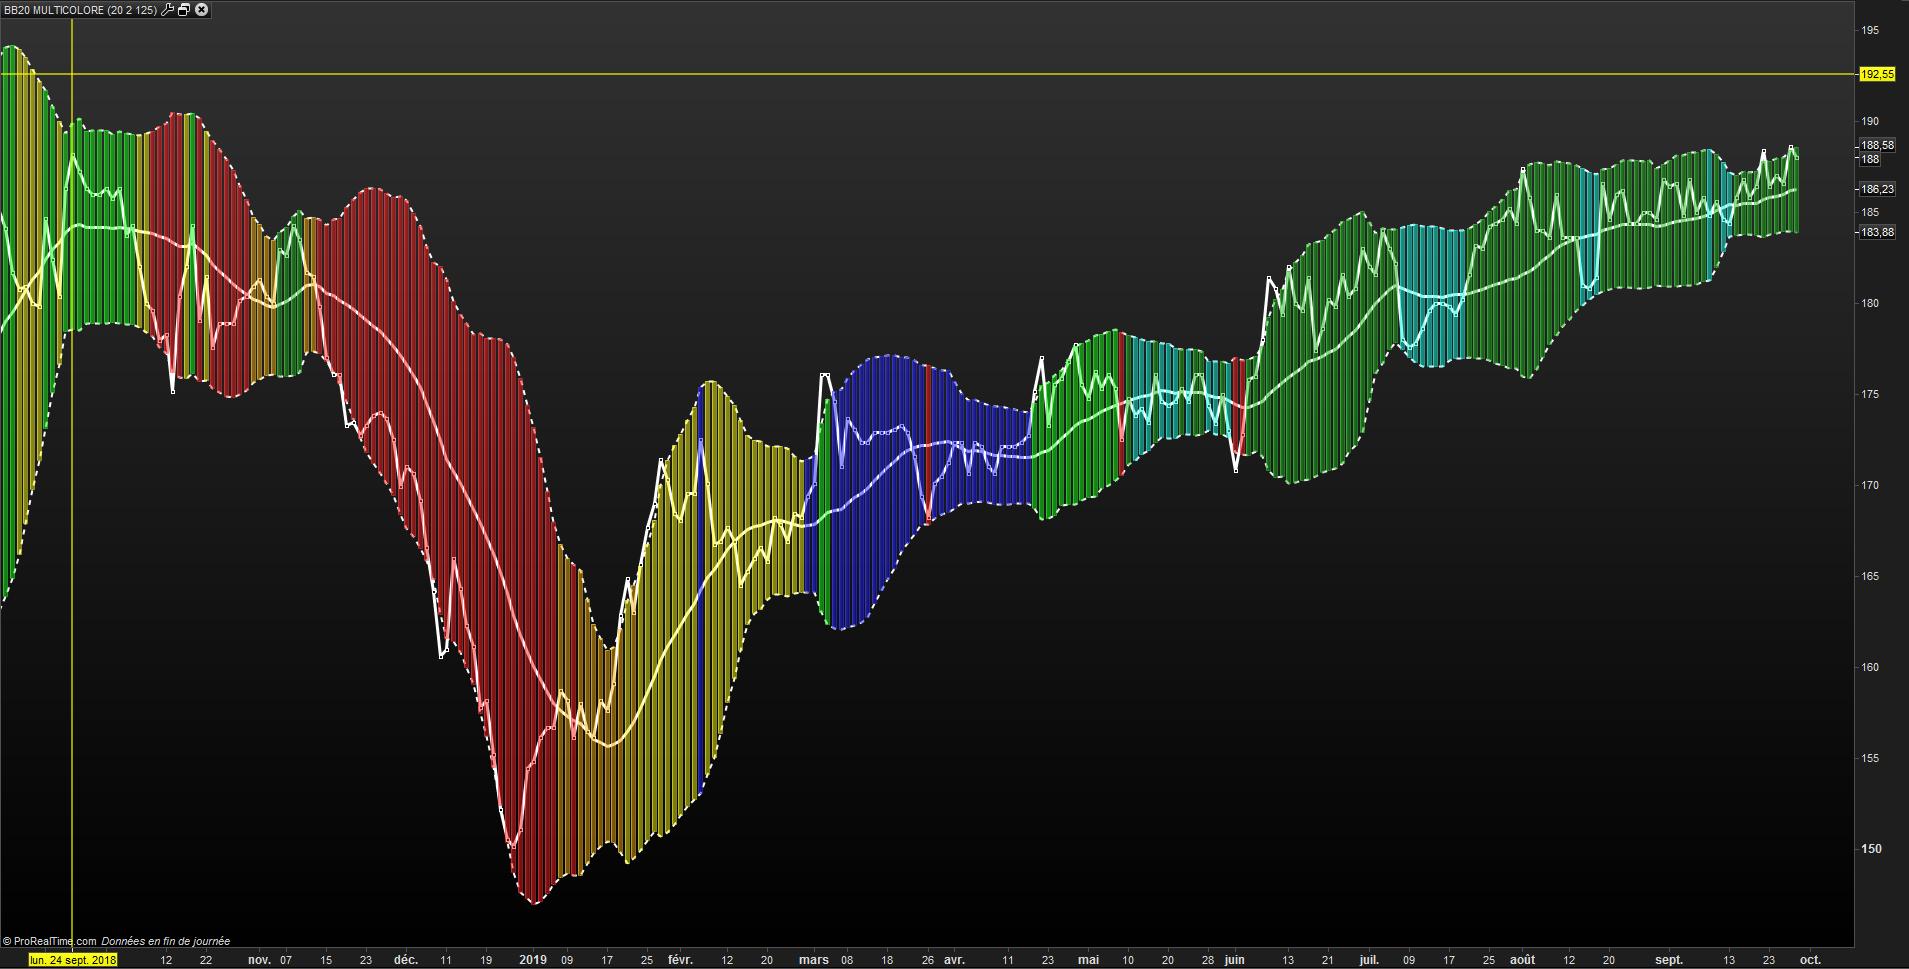
Multicolour Bollinger Bands indicator that indicates market phases. It plots on the price chart, thanks to different color zones between the bands, a breakdown of the different phases that the price operates during a trend.
The different zones are identified as follows:
- red color zone: trend is bearish, price is below the 200 periods moving average
- orange color zone: price operate a technical rebound below the 200 periods moving average
- yellow color zone: (phase 1 which indicate a new bearish cycle)
- light green zone: (phase 2 which indicate a new bullish cycle)
- dark green zone: trend is bullish, price is above the 200 periods moving average
- grey color zone: calm phase of price
- dark blue color zone: price is consolidating in either bullish or bearish trend
- light blue zones: price will revert to a new opposite trend (either long or short new trend)
By identifying clearly the different market phases with the multicolour bollinger bands, the market entries by either a the beginning of a new trend or just after a rebound or a consolidating phase is easier to spot on.
A lot of other indicators with bollinger bands can be found in the prorealtime codes library on the website. Be sure to look at them to perfectly understand how the multicolour bollinger bands can help you in your trading, whatever trading style suit you the most!
Definition of bollinger bands in wikipedia: https://en.wikipedia.org/wiki/Bollinger_Bands
// BB20 MULTICOLORE  30/09/2019

p = 20 //bb20 period
dev = 2.0 //std deviation factor
x = 90 //background alpha

MM20=average[20](close)
MM50=average[50](close)
MM100=average[100](close)
MM200=average[200](close)
BollSup =Average[p](close)+dev*std[p](close)
BollInf = Average[p](close)-dev*std[p](close)

//rouge (baissier prix sous moyenne mobile 200
c1= (close<MM200)
if c1 then
 Indicateur = close//Indicateur=1
 r=250
 g=0
 b=0
ENDIF
//orange( rebond technique)
c2= c1 and(MM20<close)
if c2 then
 Indicateur=close //=1
 r=255
 g=160
 b=0
ENDIF
//jaune (phase1 nouveau cycle)
c3= c1 and(MM50<close)and(mm50<mm200)and(close<mm200)
if c3 then
 Indicateur=close //=1
 r=800
 g=250
 b=0
ENDIF
//vert fluo ( phase 2 nouveau cycle)
c4= (MM200<close)and(MM50<close)and(MM50<MM200)
if c4 then
 Indicateur=close //=1
 r=0
 g=300
 b=0
ENDIF
//vert foncé ( au dessus de tte moyenne mobile, cycle mur)
C5= (MM200<MM50)and(MM50<close)and(MM20<close)
if c5 then
 Indicateur=close //=1
 r=0
 g=150
 b=0
ENDIF
//bleu (retournement de tendance)
c6= (MM100<MM200) and(MM50<MM200)and (close<MM200)and(MM100<close)and(MM50<MM100)
if c6 then
 Indicateur=close //=1
 r=0
 g=0
 b=300
ENDIF
//bleu (retournement de tendance 2 )
c6bis= (MM100<MM200) and(MM50<MM200)and (close<MM200)and(MM50<close)and(MM100<MM50)
if c6bis then
 Indicateur=close //=1
 r=0
 g=0
 b=300
ENDIF
//gris (phase 5 affaiblissement ou retournement à la baisse, neutre)
c7= (MM200<close) and(close<MM100)and (MM200<MM100)and(MM200<MM50)
if c7 then
Indicateur=close //=1
 r=150
 g=150
 b=150
ENDIF
//bleu bouteille (consolidation)
c8=(MM200<MM50)and(MM200<close)and(MM100<close)and((close<MM50)or(close<MM20))
if c8 then
 Indicateur=close //=1
 r=0
 g=250
 b=200
ENDIF
max1=Bollsup
min1=Bollinf
DRAWCANDLE(max1, min1, max1, min1)coloured(R,G,B,x)

RETURN MM20 style(line) as "MM20" , Bollsup as "Bollsup",Bollinf as "Bollinf", indicateur