Moving average colorized by oscillator

v10.3
Moving average colorized by oscillator

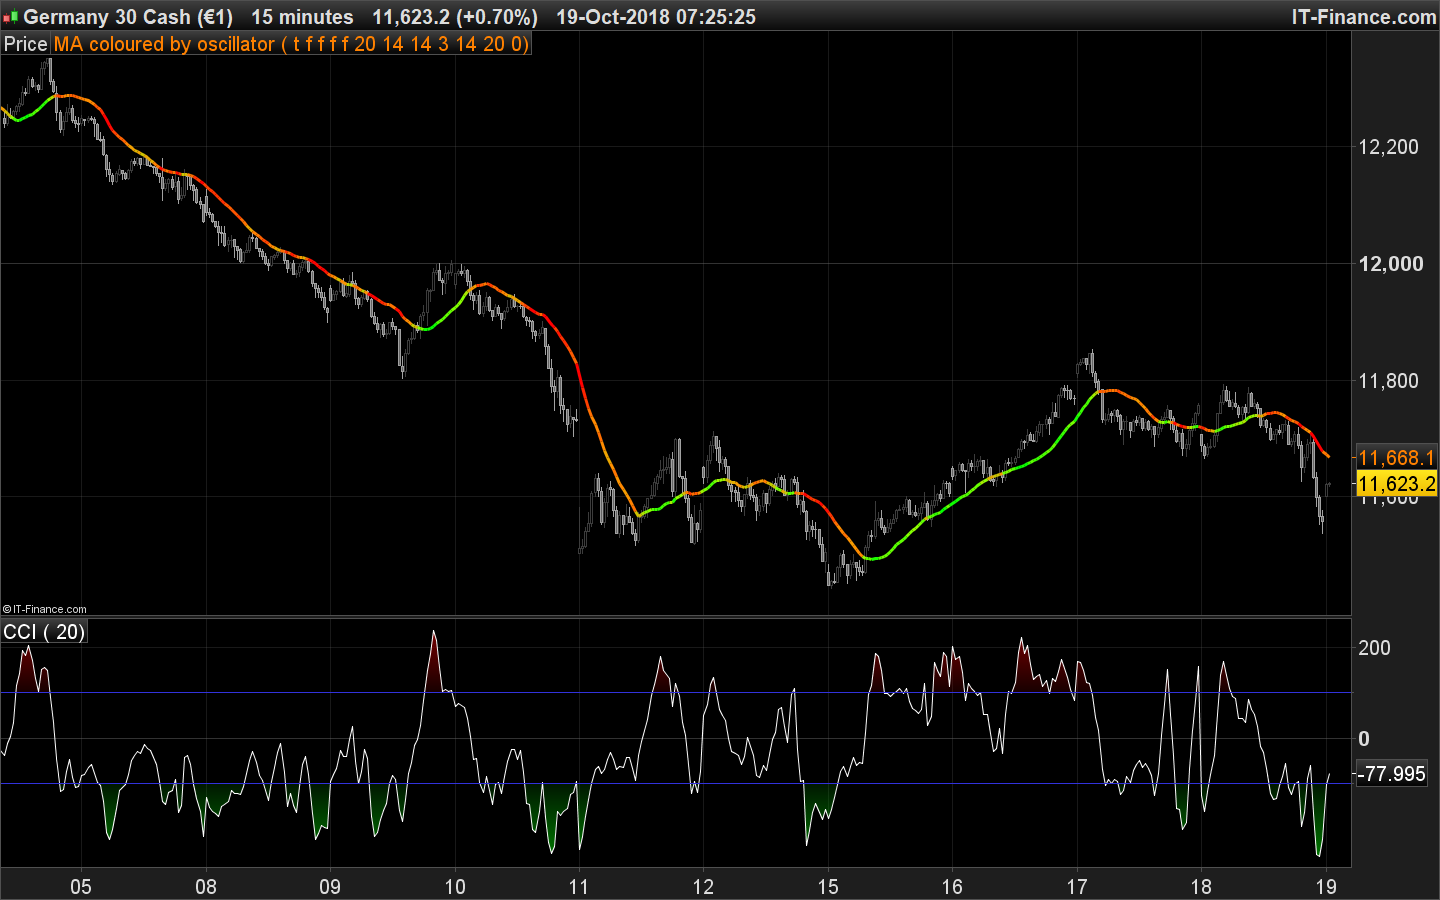
This indicator plots moving average of chosen period and type, automatically colorized from the chosen oscillator state.

5 types of oscillator can colorized the moving average depending on their overbought and oversold situation:

  • CCI (Commodity Channel Index)
  • RSI (Relative Strength Index)
  • Stochastic
  • Cycle
  • DI (Directional Index)

This indicator is based on the great version from ALE3D Candlesticks (CCI,RSI,Stochastic,Cycle,DI) and coded following a request made in the technical indicators forum.


Share this

Risk disclosure:

No information on this site is investment advice or a solicitation to buy or sell any financial instrument. Past performance is not indicative of future results. Trading may expose you to risk of loss greater than your deposits and is only suitable for experienced investors who have sufficient financial means to bear such risk.

ProRealTime ITF files and other attachments : How to import ITF files into ProRealTime platform?

PRC is also on YouTube, subscribe to our channel for exclusive content and tutorials

  1. luxrun • 10/19/2018 #

    Good evening Nicholas, I can not see the colors on the line of the moving average, but only a black line. Maybe I was wrong in the settings? Thank you

    • Nicolas • 10/19/2018 #

      Yes, you must choose the oscillator that will color the moving average.
      Example: ONCE UseCci =1

  2. XXXXVII • 10/19/2018 #

    Excellent indicateur ! Déterminer une tendance est devenu un jeu d’enfants ! Félicitation…

    Pouvez-vous m’expliquer comment changer la couleur de la moyenne mobile ?

  3. gregoire • 10/19/2018 #

    bonjour nicolas
    j ai cherché partout sur le net et impossible de trouvé ce que je recherche et je suis tombé sur cet indicateur, je recherche un cci borné entre 200 et -200 si possible que je puisse réglé, avec 3 sma avec la fonction decay (décalage)et réglage de base expo, pondéré etc, les conditions achat sont lorsque le cci est supérieur à -200 et que le cci passe au dessus de la sma 1 et sma 2 affiche arrowup et lorsque le cci passe en dessous de la sma 3 arrow up, les conditions de ventes sont les même inversé,
    cci est inferieur à 200 et que le cci passe au dessous de la sma 1 et sma 2 affiche arrowdown et lorsque le cci passe au dessus de la sma 3 arrow down,peut on affiché les arrow directement sur le graphique si possible et que je puisse bidouillé le code parce que j apprend mais pas encore en mesure de le faire moi même mais c est comme cela qu on apprend je crois bien.
    si c était possible d avoir un coup de main cela serait vraiment très gentil de votre part et motiverais un débutant, je vous remercie pour tout le travail que vous fournissez sur votre site c est vraiment remarquable.
    très cordialement.
    merci
    greg

    • Nicolas • 10/19/2018 #

      Merci de poster une demande dans le forum des indicateurs, ainsi on pourra le coder dans ce contexte.

avatar
Register or

Likes

avatar avatar avatar avatar avatar avatar avatar avatar avatar avatar
Related users ' posts
supertiti hola Ivan Eso quiere decir que el Parabolic sar RSI est igual al parabolic sar de PRT ? p...
supertiti buenas tardes Ivan me gusteria tener lo mismo on chart con los puntos azules y rosas de c...
LucasBest Thanks for the translation. This one can be compared to dynamic zone RSI
Iván
1 month ago
lee HI thank you for this indicator. Is it possible to create a screener based on this for when ...
luxrun grazie Ivàn!
lee Thank you. Is it possible to convert this to a screener that displays instruments when bulli...
Iván //---------------------------------------------------------------// //PRC_Pollan Indicator /...
Faisalx ChatGPT Hola Iván. Gracias por tu excelente trabajo. Te agradecería si pudieras echarle un...
Iván ok, perfecto! me pongo con ello
Iván Hi, Sorry, but what do you mean?
luiskohnen Hola, queria saber si el indicador repinta, porque a mi me parecio que si. Saludos y gracias...
Diamant Bonsoir, L'un d'entre vous peut-il me donner les définissions de LL-HH-LH et HL. Merci d'av...
Bernard13 (Je réécris mon commentaire -français- en français car certains mots ne correspondaient pas ...
Iván 1000 indicateurs !!! brutaux
Iván Gracias! Para el screener sólo tienes que copiar el indicador y poner como condición de búsq...
Lean Muchas gracias Iván, ya lo he podido crear.
bertoluce Hello Ivan, thank you very much for the indicator. An observation: would it be possible (and...
Bateson
2 years ago
Matriciel Very nice job ! Is it possible to do the opposite because what interests me is to have the ...
YvesRobert Hi Matriciel, how can we do this, because stochastic is limited between 0 and 100 but price ...
Traderfox06 Dear zeiiermantrading, I really like your approach combining adaptive averages with MACD in...
jacquesgermain Hello IASD it's normal , when this occurs, uncheck RSI and MFI line and click then the MAC...
emiliobercial Thank you very much for sharing!
Carlose estoy de acuerdo con IASD Esta muy bien el MAD y el indicador en el precio no se ven bien...
bousalahane merci pour le partage de cet l'indicateur, j'ai rajouté un autre indicateur pour faire une s...
joaoarcher Hi, thank you for the this. Is it possible to create a screener from this indicator, so that...

Top