I have updated and I hope improved the indicator originally created by throwaway200 that can be found here:
https://www.prorealcode.com/prorealtime-indicators/active-hours-trading-indicator/
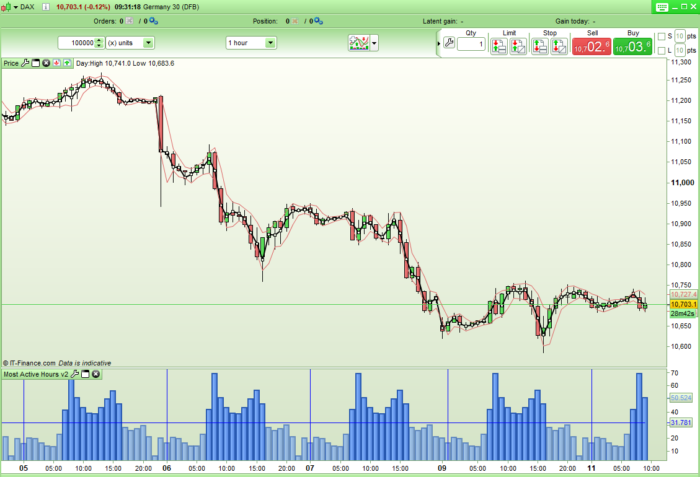
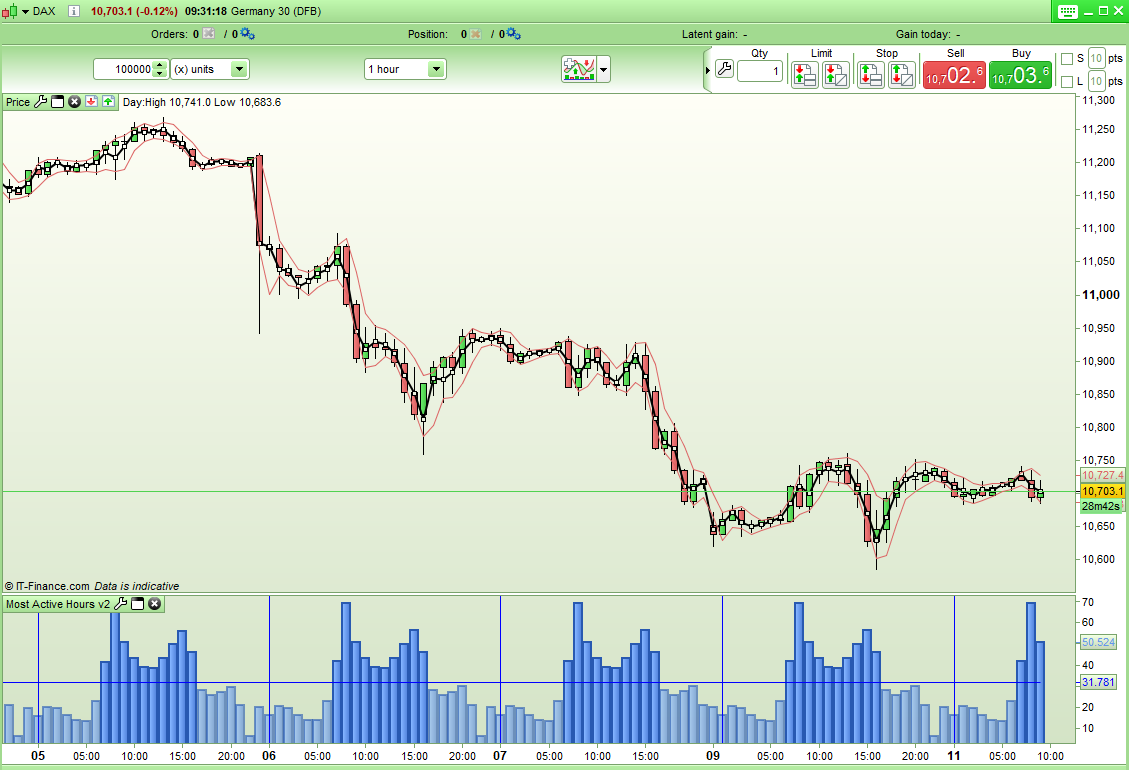
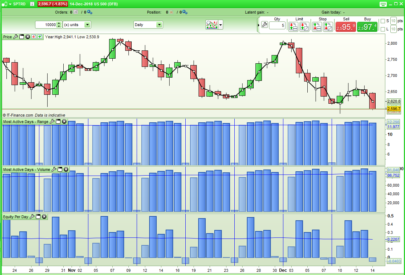
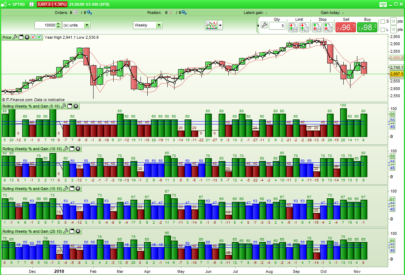
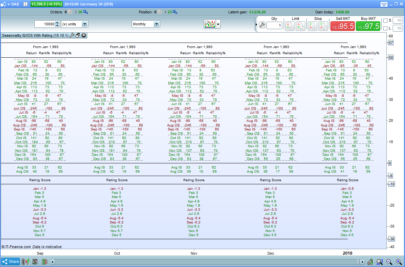
I have improved the graphical output so as to make it easier to see which hours are the most active on any market. I have also converted the same code into a separate indicator to analyse which are the most active months.
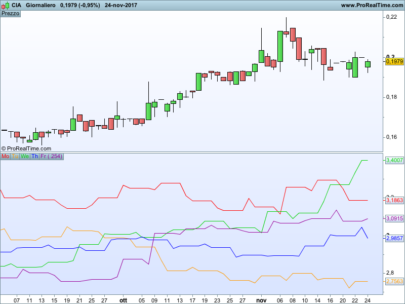
The bar chart under each hour/month shows the all time average for that particular hour or month. There is also an all time all hours/ all months average line. Any hour/month whose average is above the all time average is highlighted by a darker bar so that it can be easily seen which are the most active hours/months to trade. The start of a new day/ new year is highlighted by a vertical line through the first hour of the day or through January.
There are two separate indicators to upload or copy. One for hourly analysis and one for monthly analysis. Apply the hourly one only to the hourly chart and the monthly one only to the monthly chart.
Thanks to throwaway200 for the original idea.
Here is the Most Active Hours code:
|
1 2 3 4 5 6 7 8 9 10 11 12 13 14 15 16 17 18 19 20 21 22 23 24 25 26 27 28 29 30 31 32 33 34 35 36 37 38 39 40 41 42 43 44 45 46 47 48 49 50 51 52 53 54 55 56 57 58 59 60 61 62 63 64 65 66 67 68 69 70 71 72 73 74 75 76 77 78 79 80 81 82 83 84 85 86 87 88 89 90 91 92 93 94 95 96 97 98 99 100 101 102 103 104 105 106 107 108 109 110 111 112 113 |
//Most Active Hours //By Vonasi (thanks to throwaway200 for the idea) //20181211 //defparam calculateonlastbars = 1000 IF openhour = 0 THEN H0 = (H0 + (High - Low)) H0Count = (H0Count + 1) ThisHour = (H0 / H0Count) drawvline(barindex) coloured(0,0,255) ELSIF openhour = 1 THEN H1 = (H1 + (High - Low)) H1Count = (H1Count + 1) ThisHour = (H1 / H1Count) ELSIF openhour = 2 THEN H2 = (H2 + (High - Low)) H2Count = (H2Count + 1) ThisHour = (H2 / H2Count) ELSIF openhour = 3 THEN H3 = (H3 + (High - Low)) H3Count = (H3Count + 1) ThisHour = (H3 / H3Count) ELSIF openhour = 4 THEN H4 = (H4 + (High - Low)) H4Count = (H4Count + 1) ThisHour = (H4 / H4Count) ELSIF openhour = 5 THEN H5 = (H5 + (High - Low)) H5Count = (H5Count + 1) ThisHour = (H5 / H5Count) ELSIF openhour = 6 THEN H6 = (H6 + (High - Low)) H6Count = (H6Count + 1) ThisHour = (H6 / H6Count) ELSIF openhour = 7 THEN H7 = (H7 + (High - Low)) H7Count = (H7Count + 1) ThisHour = (H7 / H7Count) ELSIF openhour = 8 THEN H8 = (H8 + (High - Low)) H8Count = (H8Count + 1) ThisHour = (H8 / H8Count) ELSIF openhour = 9 THEN H9 = (H9 + (High - Low)) H9Count = (H9Count + 1) ThisHour = (H9 / H9Count) ELSIF openhour = 10 THEN H10 = (H10 + (High - Low)) H10Count = (H10Count + 1) ThisHour = (H10 / H10Count) ELSIF openhour = 11 THEN H11 = (H11 + (High - Low)) H11Count = (H11Count + 1) ThisHour = (H11 / H11Count) ELSIF openhour = 12 THEN H12 = (H12 + (High - Low)) H12Count = (H12Count + 1) ThisHour = (H12 / H12Count) ELSIF openhour = 13 THEN H13 = (H13 + (High - Low)) H13Count = (H13Count + 1) ThisHour = (H13 / H13Count) ELSIF openhour = 14 THEN H14 = (H14 + (High - Low)) H14Count = (H14Count + 1) ThisHour = (H14 / H14Count) ELSIF openhour = 15 THEN H15 = (H15 + (High - Low)) H15Count = (H15Count + 1) ThisHour = (H15 / H15Count) ELSIF openhour = 16 THEN H16 = (H16 + (High - Low)) H16Count = (H16Count + 1) ThisHour = (H16 / H16Count) ELSIF openhour = 17 THEN H17 = (H17 + (High - Low)) H17Count = (H17Count + 1) ThisHour = (H17 / H17Count) ELSIF openhour = 18 THEN H18 = (H18 + (High - Low)) H18Count = (H18Count + 1) ThisHour = (H18 / H18Count) ELSIF openhour = 19 THEN H19 = (H19 + (High - Low)) H19Count = (H19Count + 1) ThisHour = (H19 / H19Count) ELSIF openhour = 20 THEN H20 = (H20 + (High - Low)) H20Count = (H20Count + 1) ThisHour = (H20 / H20Count) ELSIF openhour = 21 THEN H21 = (H21 + (High - Low)) H21Count = (H21Count + 1) ThisHour = (H21 / H21Count) ELSIF openhour = 22 THEN H22 = (H22 + (High - Low)) H22Count = (H22Count + 1) ThisHour = (H22 / H22Count) ELSIF openhour = 23 THEN H23 = (H23 + (High - Low)) H23Count = (H23Count + 1) ThisHour = (H23 / H23Count) ENDIF avg = (h0 + h1 + h2 + h3 + h4 + h5 + h6 + h7 + h8 + h9 + h10 + h11 + h12 + h13 + h14 + h15 + h16 + h17 + h18 + h19 + h20 + h21 + h22 + h23)/(h0count + h1count + h2count + h3count + h4count + h5count + h6count + h7count + h8count + h9count + h10count + h11count + h12count + h13count + h14count + h15count + h16count + h17count + h18count + h19count + h20count + h21count + h22count + h23count) c = 155 if ThisHour > Avg then c = 255 endif RETURN thishour coloured (100,149,237,c) style(histogram, 2) as "Average Range", avg coloured(0,0,255) style(line,1) as "All Time Average" |
Here is the Most Active Months code:
|
1 2 3 4 5 6 7 8 9 10 11 12 13 14 15 16 17 18 19 20 21 22 23 24 25 26 27 28 29 30 31 32 33 34 35 36 37 38 39 40 41 42 43 44 45 46 47 48 49 50 51 52 53 54 55 56 57 58 59 60 61 62 63 64 65 |
//Most Active Monthss //By Vonasi (thanks to throwaway200 for the idea) //20181211 //defparam calculateonlastbars = 1000 IF openmonth = 1 THEN H1 = (H1 + (High - Low)) H1Count = (H1Count + 1) ThisMonth = (H1 / H1Count) drawvline(barindex) coloured(0,0,255) ELSIF openmonth = 2 THEN H2 = (H2 + (High - Low)) H2Count = (H2Count + 1) ThisMonth = (H2 / H2Count) ELSIF openmonth = 3 THEN H3 = (H3 + (High - Low)) H3Count = (H3Count + 1) ThisMonth = (H3 / H3Count) ELSIF openmonth = 4 THEN H4 = (H4 + (High - Low)) H4Count = (H4Count + 1) ThisMonth = (H4 / H4Count) ELSIF openmonth = 5 THEN H5 = (H5 + (High - Low)) H5Count = (H5Count + 1) ThisMonth = (H5 / H5Count) ELSIF openmonth = 6 THEN H6 = (H6 + (High - Low)) H6Count = (H6Count + 1) ThisMonth = (H6 / H6Count) ELSIF openmonth = 7 THEN H7 = (H7 + (High - Low)) H7Count = (H7Count + 1) ThisMonth = (H7 / H7Count) ELSIF openmonth = 8 THEN H8 = (H8 + (High - Low)) H8Count = (H8Count + 1) ThisMonth = (H8 / H8Count) ELSIF openmonth = 9 THEN H9 = (H9 + (High - Low)) H9Count = (H9Count + 1) ThisMonth = (H9 / H9Count) ELSIF openmonth = 10 THEN H10 = (H10 + (High - Low)) H10Count = (H10Count + 1) ThisMonth = (H10 / H10Count) ELSIF openmonth = 11 THEN H11 = (H11 + (High - Low)) H11Count = (H11Count + 1) ThisMonth = (H11 / H11Count) ELSIF openmonth = 12 THEN H12 = (H12 + (High - Low)) H12Count = (H12Count + 1) ThisMonth = (H12 / H12Count) ENDIF avg = (h1 + h2 + h3 + h4 + h5 + h6 + h7 + h8 + h9 + h10 + h11 + h12)/(h1count + h2count + h3count + h4count + h5count + h6count + h7count + h8count + h9count + h10count + h11count + h12count) c = 155 if ThisMonth > Avg then c = 255 endif RETURN ThisMonth coloured (100,149,237,c) style(histogram, 2) as "Average Range", avg coloured(0,0,255) style(line,1) as "All Time Average" |
Share this
No information on this site is investment advice or a solicitation to buy or sell any financial instrument. Past performance is not indicative of future results. Trading may expose you to risk of loss greater than your deposits and is only suitable for experienced investors who have sufficient financial means to bear such risk.
ProRealTime ITF files and other attachments :
Find other exclusive trading pro-tools on ![]()
PRC is also on YouTube, subscribe to our channel for exclusive content and tutorials


Very Very Nice
Hi – Many thanks for this and your other analytical codes, stellar work – very useful ! With regards to the monthly one especially would it be better to show the range as a % (say,of the opening index value) rather than absolute points ? This is because with high value indices the trend is going to be rising naturally over 10-20yrs so it masks how todays range is compared to historics.
Good idea Manel. I have posted a new version here that shows results as a percentage: https://www.prorealcode.com/topic/most-active-months-range-v2/