

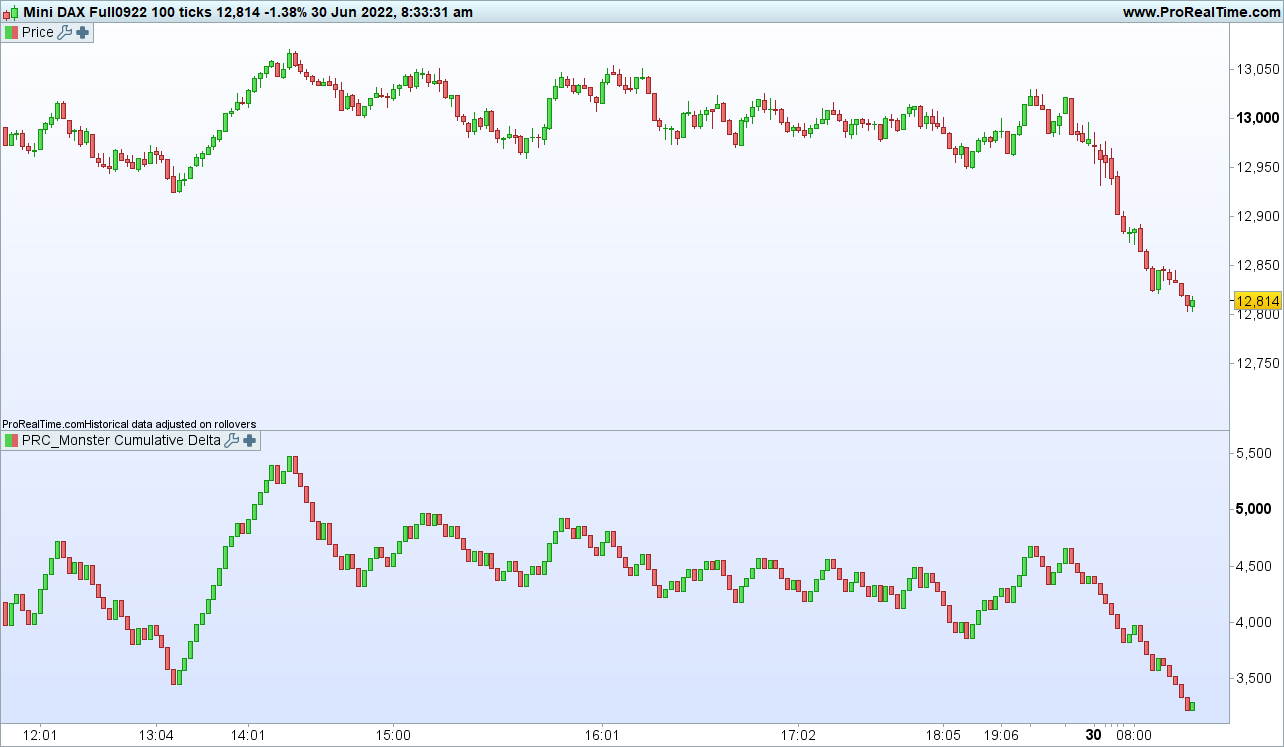
Monster Cumulative Delta
June 30, 2022, 7:38 AM
Indicators
6 Comments
it uses an approximation of Up and Down Volume (because they are not kept by Tradingview/not accessible by Pinescript).
The approximation is:
The “up path” on the “up” candle can be approximated by ( High-Low ).
The “down path” on the “up” candle can be approximated by (High-Close)+(Open-Low).
(and similar for the down candle, like in the 1st post.)
Total path=up path + down path.
Up volume = Tick volume * up path/total path
Down volume = Tick volume * down path/total path
(description from original author: kprsa)
//PRC_Monster Cumulative Delta | indicator
//30.06.2022
//Nicolas @ www.prorealcode.com
//Sharing ProRealTime knowledge
//converted from pinescript

//U1
if(close>=open and (close-open+2*(high-close)+2*(open-low)))>0 then
 U1= volume*(high-low)/(close-open+2*(high-close)+2*(open-low))
else
 U1=0.0
endif
//D1
if(close<open and (open-close+2*(high-open)+2*(close-low)))>0 then
 D1 = volume*(high-low)/(open-close+2*(high-open)+2*(close-low))
else
 D1=0.0
endif
//Delta
if(close>=open) then
 Delta= U1
else
 Delta= -D1
endif

if barindex>1 then
 cumDelta=(cumDelta[1])+Delta

 if close>=open then
  hi= cumDelta
 else
  hi =cumDelta[1]
 endif
 if close<=open then
  lo= cumDelta
 else
  lo=cumDelta[1]
 endif

 drawcandle(cumDelta[1], hi, lo, cumDelta)
endif

return
Download
Filename:
PRC_Monster-Cumulative-Delta.itf
Downloads:
327
Master
I created ProRealCode because I believe in the power of shared knowledge. I spend my time coding new tools and helping members solve complex problems.
If you are stuck on a code or need a fresh perspective on a strategy, I am always willing to help. Welcome to the community!
Author’s Profile
Loading...