

momentum bias index
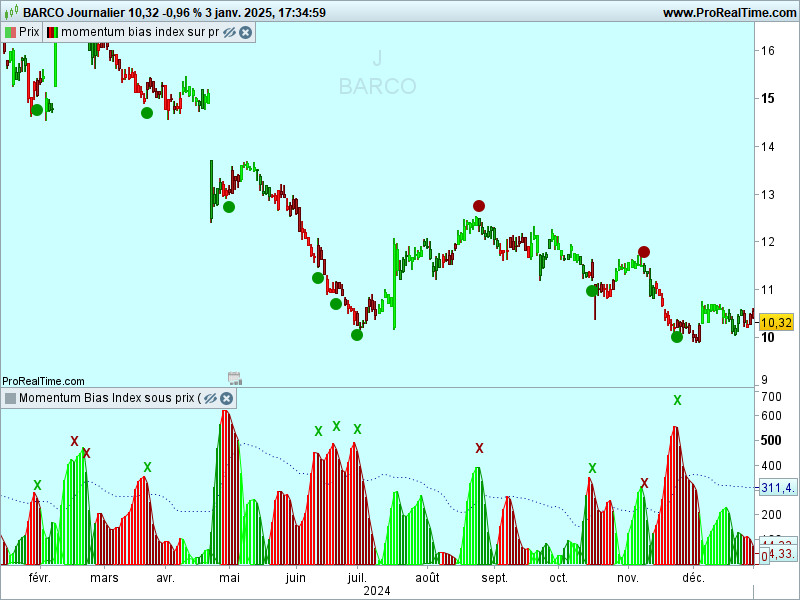
Description: AlgoAlpha’s Momentum Bias Index is designed to provide traders with a powerful tool for assessing market momentum bias. The indicator calculates positive and negative momentum bias to assess which is higher in order to determine the trend.
Main features:Full momentum analysis: the script aims to detect momentum trend bias, typically in an uptrend, the momentum oscillator will oscillate around the zero line but will have stronger positive values than negative ones, similarly for a downtrend, momentum will have stronger negative values. . This script aims to quantify this phenomenon.
Overlay mode: traders can choose to overlay the indicator on the price chart for a clear visual representation of market dynamics.
Take-profit signals: the indicator includes signals to lock in profits, appearing as dots with the over-price indicator and as crosses with the under-price indicator.
Impulse limit: the script includes an impulse limit. The impulse limit is a threshold for visualizing significant impulse peaks.
Standard deviation multiplier: users can adjust the standard deviation multiplier to increase the noise tolerance of the impulse limit.
Bias length control: traders can customize the bias evaluation length, enabling them to fine-tune the indicator to their trading preferences. A longer bias length will result in a longer-term trend bias.
momentum bias index on price :
momentumLength = 10
biasLength = 5
smoothLength = 10
impulseBoundaryLength = 30
stdDevMultiplier = 3
smoothIndicator =1
// Calcul de Momentum et Déviation Standard
moment = close - close[momentumLength]
stdDev = moment / ExponentialAverage[momentumLength](high - low) * 100
momentumUp = max(stdDev, 0)
momentumDown = min(stdDev, 0)
// Calcul des sommes avec une boucle
sumMomentumUp = 0
sumMomentumDown = 0
FOR i = 0 TO biasLength - 1 DO
sumMomentumUp = sumMomentumUp + momentumUp[i]
sumMomentumDown = sumMomentumDown + momentumDown[i]
NEXT
// Lissage et calcul des biais avec HMA intégrée
IF smoothIndicator=1 THEN
// Calcul de la Hull Moving Average (HMA) pour momentumUp
wmaHalfUp = WeightedAverage[ROUND(smoothLength / 2)](momentumUp)
wmaFullUp = WeightedAverage[smoothLength](momentumUp)
hullIntermediateUp = 2 * wmaHalfUp - wmaFullUp
smoothedMomentumUp = WeightedAverage[ROUND(SQRT(smoothLength))](hullIntermediateUp)
// Calcul de la Hull Moving Average (HMA) pour momentumDown
wmaHalfDown = WeightedAverage[ROUND(smoothLength / 2)](momentumDown)
wmaFullDown = WeightedAverage[smoothLength](momentumDown)
hullIntermediateDown = 2 * wmaHalfDown - wmaFullDown
smoothedMomentumDown = WeightedAverage[ROUND(SQRT(smoothLength))](hullIntermediateDown)
momentumUpBias = max(smoothedMomentumUp, 0)
momentumDownBias = max(-smoothedMomentumDown, 0)
ELSE
IF smoothIndicator=0 THEN
momentumUpBias = max(sumMomentumUp, 0)
momentumDownBias = max(-sumMomentumDown, 0)
ENDIF
ENDIF
// Moyenne des biais
averageBias = (momentumDownBias + momentumUpBias) / 2
// Calcul de la limite (boundary)
boundary = ExponentialAverage[impulseBoundaryLength](averageBias) + STD[impulseBoundaryLength](averageBias) * stdDevMultiplier
// Affichage des signaux
bullishSignal = momentumDownBias < momentumDownBias[1] AND momentumDownBias > boundary AND momentumDownBias > momentumUpBias
bearishSignal = momentumUpBias < momentumUpBias[1] AND momentumUpBias > boundary AND momentumUpBias > momentumDownBias
IF bullishSignal AND NOT bullishSignal[1] THEN
DRAWPOINT(barindex, low-0.02*low, 3)coloured(0,150,0)
//DRAWTEXT("TP", barindex,low-0.02*low, dialog, bold, 14) COLOURED(0, 150, 0)
ENDIF
IF bearishSignal AND NOT bearishSignal[1] THEN
DRAWPOINT(barindex, high+0.02*high,3)coloured(150,0,0)
//DRAWTEXT("TP", barindex,high+0.02*high, dialog, bold, 14) COLOURED(150,0, 0)
ENDIF
IF momentumUpBias > momentumUpBias[1] AND NOT (momentumDownBias > momentumDownBias[1]) THEN
r = 0
g = 255
b = 0
ELSIF momentumUpBias < momentumUpBias[1] AND NOT (momentumDownBias < momentumDownBias[1]) THEN
r = 0
g = 150
b = 0
ELSIF momentumDownBias > momentumDownBias[1] AND NOT (momentumUpBias > momentumUpBias[1]) THEN
r = 255
g = 0
b = 0
ELSIF momentumDownBias < momentumDownBias[1] AND NOT (momentumUpBias < momentumUpBias[1]) THEN
// Couleur rouge atténuée
r = 150
g = 0
b = 0
ENDIF
// Application des couleurs aux chandeliers
DRAWCANDLE(open, high, low, close) COLOURED(r,g,b)
RETURN
momentum bias index below price :
momentumLength = 10
biasLength = 5
smoothLength = 10
impulseBoundaryLength = 30
stdDevMultiplier = 3
smoothIndicator =1
// Calcul de Momentum et Déviation Standard
moment = close - close[momentumLength]
stdDev = moment / ExponentialAverage[momentumLength](high - low) * 100
momentumUp = max(stdDev, 0)
momentumDown = min(stdDev, 0)
// Calcul des sommes avec une boucle
sumMomentumUp = 0
sumMomentumDown = 0
FOR i = 0 TO biasLength - 1 DO
sumMomentumUp = sumMomentumUp + momentumUp[i]
sumMomentumDown = sumMomentumDown + momentumDown[i]
NEXT
// Lissage et calcul des biais avec HMA intégrée
IF smoothIndicator=1 THEN
// Calcul de la Hull Moving Average (HMA) pour momentumUp
wmaHalfUp = WeightedAverage[ROUND(smoothLength / 2)](momentumUp)
wmaFullUp = WeightedAverage[smoothLength](momentumUp)
hullIntermediateUp = 2 * wmaHalfUp - wmaFullUp
smoothedMomentumUp = WeightedAverage[ROUND(SQRT(smoothLength))](hullIntermediateUp)
// Calcul de la Hull Moving Average (HMA) pour momentumDown
wmaHalfDown = WeightedAverage[ROUND(smoothLength / 2)](momentumDown)
wmaFullDown = WeightedAverage[smoothLength](momentumDown)
hullIntermediateDown = 2 * wmaHalfDown - wmaFullDown
smoothedMomentumDown = WeightedAverage[ROUND(SQRT(smoothLength))](hullIntermediateDown)
momentumUpBias = max(smoothedMomentumUp, 0)
momentumDownBias = max(-smoothedMomentumDown, 0)
ELSE
IF smoothIndicator=0 THEN
momentumUpBias = max(sumMomentumUp, 0)
momentumDownBias = max(-sumMomentumDown, 0)
ENDIF
ENDIF
// Moyenne des biais
averageBias = (momentumDownBias + momentumUpBias) / 2
// Calcul de la limite (boundary)
boundary = ExponentialAverage[impulseBoundaryLength](averageBias) + STD[impulseBoundaryLength](averageBias) * stdDevMultiplier
// Affichage des signaux
bullishSignal = momentumDownBias < momentumDownBias[1] AND momentumDownBias > boundary AND momentumDownBias > momentumUpBias
bearishSignal = momentumUpBias < momentumUpBias[1] AND momentumUpBias > boundary AND momentumUpBias > momentumDownBias
IF bullishSignal AND NOT bullishSignal[1] THEN
DRAWTEXT("X", barindex, momentumDownBias + 0.2 * momentumDownBias, dialog, bold, 14) COLOURED(0, 175, 0)
ENDIF
IF bearishSignal AND NOT bearishSignal[1] THEN
DRAWTEXT("X", barindex, momentumUpBias + 0.2 * momentumUpBias, dialog, bold, 14) COLOURED(150, 0, 0)
ENDIF
IF momentumUpBias > momentumUpBias[1] AND NOT (momentumDownBias > momentumDownBias[1]) THEN
// Couleur verte vive
r = 0
g = 255
b = 0
ELSIF momentumUpBias < momentumUpBias[1] AND NOT (momentumDownBias < momentumDownBias[1]) THEN
// Couleur verte atténuée
r = 0
g = 150
b = 0
ELSIF momentumDownBias > momentumDownBias[1] AND NOT (momentumUpBias > momentumUpBias[1]) THEN
// Couleur rouge vive
r = 255
g = 0
b = 0
ELSIF momentumDownBias < momentumDownBias[1] AND NOT (momentumUpBias < momentumUpBias[1]) THEN
// Couleur rouge atténuée
r = 150
g = 0
b = 0
ENDIF
// Application des couleurs aux histogrammes
RETURN boundary COLOURED(0, 0, 150) STYLE(DOTTEDLINE4) AS "boundary",momentumUpBias COLOURED(r, g, b) STYLE(histogram, 1) AS "momentumUp",momentumDownBias COLOURED(r, g, b) STYLE(histogram, 3) AS "momentumDown",momentumUpBias COLOURED(r, g, b) STYLE(line, 1) AS "lmomentumUp",momentumDownBias COLOURED(r, g, b) STYLE(line, 1) AS "lmomentumDown"