

Mean Reversion Channel (MRI) Indicator
1. Introduction
Mean reversion is a key concept in technical analysis, suggesting that asset prices tend to revert to their average value after significant deviations. This behavior is particularly useful in sideways or highly volatile markets, where buying and selling opportunities arise when prices reach extreme levels.
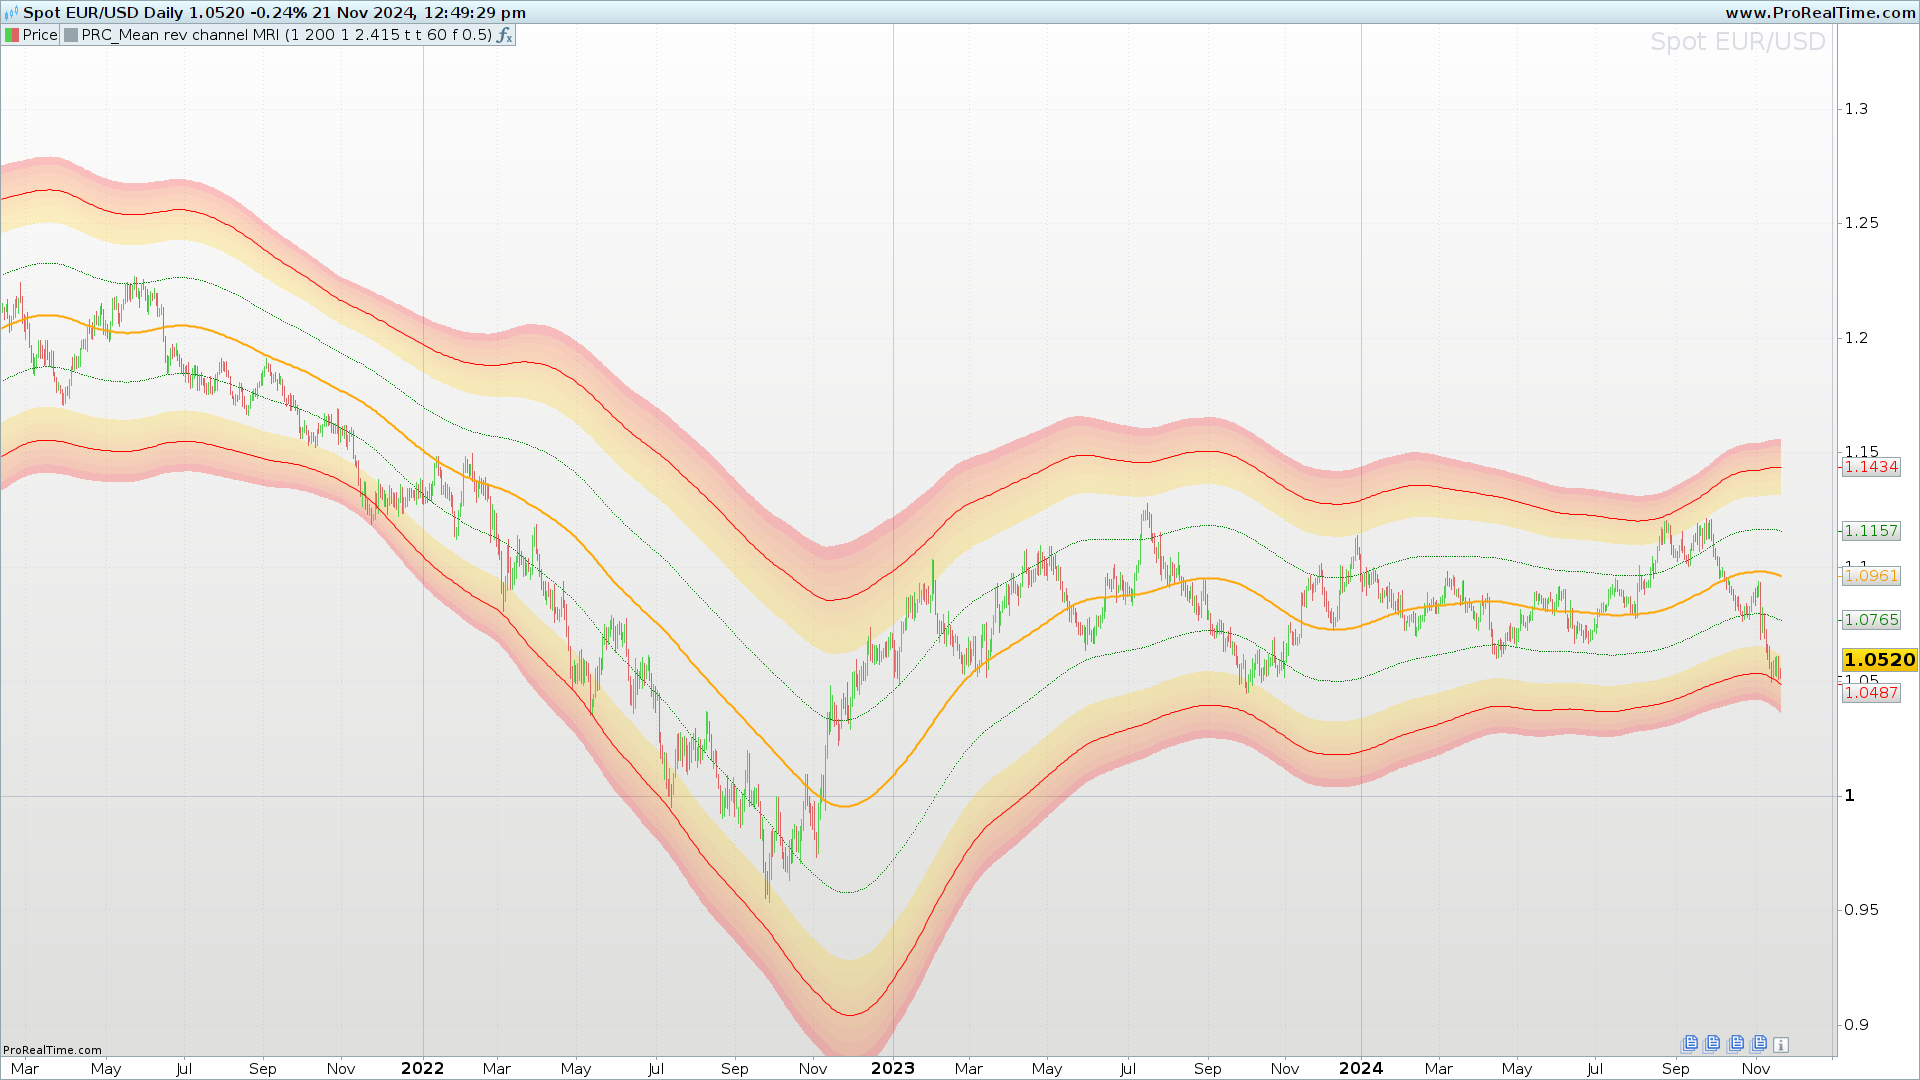
The Mean Reversion Channel (MRI) is designed to identify these reversion zones using dynamic channels and visual gradients. Its advanced structure not only detects critical levels but also evaluates the strength of signals based on the price’s position within the channel.
2. What is the Mean Reversion Channel (MRI)?
The Mean Reversion Channel (MRI) is a technical indicator that combines moving averages, volatility, and probability channels to provide a clear view of overbought and oversold zones. This visually intuitive tool highlights different gradient zones on the chart, helping traders make decisions based on clear data.
Its primary focus is to identify:
- High-probability reversion zones: Based on the price’s distance from the mean.
- Movement intensity: Represented by colors and gradients that emphasize critical areas.
3. Key Components of the Indicator
The MRI consists of the following main elements:
Mean Line
This line acts as the core of the indicator and represents the average price over a defined period. It is calculated using different methods (EMA, SMA, Gaussian, among others), which the user can select according to their needs.
- Significance: The mean line serves as the reference point from which price deviations are evaluated. A price above this line may indicate overbought conditions, while a price below it may suggest oversold conditions.
Channel Bands
The indicator defines two sets of bands:
- Inner bands: Closer to the mean line, showing minor deviations.
- Outer bands: Indicating more significant deviations, often considered high-probability reversion zones.
- Calculation: Bands are calculated by multiplying the average true range (ATR) by adjustable factors, allowing customization for different strategies and markets.
Gradient Zones
These zones are designed to show the market’s intensity. They use colors and transparencies to differentiate:
- Extreme levels within the channel.
- Intensity of buying or selling pressure.
4. Configuration and Customization of the Indicator
The MRI is highly customizable, making it a flexible tool for various trading styles. Some of the most important parameters are:
- Period Length (length): Defines the number of bars used to calculate the mean. A shorter period creates a more sensitive indicator, while a longer period smooths out fluctuations.
- Mean Type (type): Allows selection of different calculation methods like EMA, SMA, or Gaussian.
- Channel Multipliers (innermult and outermult): Adjust the distance of the inner and outer bands from the mean line.
- Gradient Zones (gradsize and zonetransp): Configure the intensity and transparency of the colors within the channel zones.
Example configuration for highly volatile markets:
- Period: 100 bars.
- Multipliers: 1 for the inner bands and 2.5 for the outer bands.
- Zones: Gradient of 0.5 and 60% transparency.
5. How to Interpret the Indicator
The MRI generates signals based on the interaction of price with the bands and the mean line:
Buy Signals
- Lower Inner Zone: When the price touches or crosses the lower inner band, it may signal a buying opportunity if a reversion toward the mean is expected.
- Lower Outer Zone: If the price touches the lower outer band, it indicates an even higher probability of reversion, ideal for more aggressive entries.
Sell Signals
- Upper Inner Zone: When the price reaches or crosses the upper inner band, it may signal a selling opportunity.
- Upper Outer Zone: Reaching the upper outer band confirms an extreme overbought condition.
Gradient Zones
The channel’s colors and transparencies help assess the strength of signals:
- Darker tones indicate levels closer to the mean, suggesting a lower probability of reversion.
- Lighter tones indicate extreme levels, where reversion probabilities are higher.
6. Advantages and Limitations
Advantages
- Versatility: Works well in volatile and sideways markets.
- Visually Intuitive: Colored zones make it easy to identify opportunities quickly.
- Adaptability: Adjustable parameters allow customization for different assets and trading styles.
Limitations
- Not Foolproof: Like any indicator, it may generate false signals, especially in strongly trending markets.
- Requires Confirmation: It is recommended to use it alongside other indicators or technical analysis tools to improve signal accuracy.
7. Conclusion
The Mean Reversion Channel (MRI) is a powerful tool for identifying overbought and oversold zones in various markets. Its visual design and flexibility make it an ideal resource for traders looking to operate under mean reversion conditions. However, it’s important to remember that no indicator is perfect, and its effectiveness increases when combined with additional analysis.
We encourage users to experiment with the MRI’s parameters to tailor it to their specific needs and maximize its utility in technical analysis.
//----------------------------------------//
//PRC_Mean reversion channel MRI
//version = 0
//21.11.24
//Iván González @ www.prorealcode.com
//Sharing ProRealTime knowledge
//----------------------------------------//
// inputs
//----------------------------------------//
source=(high+close+low)/3
type=1 //1=SuperSmoother 2=Ehlers EMA 3=Gaussian 4=BandStop 5=SMA 6=EMA 7=RMA
length=200
innermult=1 //inner Channel Multiplier
outermult=2.415 //Outer Channel Multiplier
drawchannel=1
displayzone=1
zonetransp=60
displayline=0
gradsize=0.5
pi=3.1416
mult=pi*innermult
mult2=pi*outermult
//----------------------------------------//
//Aux Supersmoother
//----------------------------------------//
sa1=exp(-sqrt(2)*pi/length)
sb1=2*sa1*cos(sqrt(2)*180/length)
sc3=-pow(sa1,2)
sc2=sb1
sc1=1-sc2-sc3
//----------------------------------------//
//Aux SAK Supersmoother
//----------------------------------------//
cycl=2*180/length
c0=1
c1=0
b0=1
b1=0
b2=0
a1=0
a2=0
alpha=0
beta=0
gamma=0
if type=2 then //Ehlers EMA
alpha=(cos(cycl)+sin(cycl)-1)/cos(cycl)
b0=alpha
a1=1-alpha
elsif type=3 then//Gaussian
beta=2.415*(1-cos(cycl))
alpha=-beta+sqrt((beta*beta)+(2*beta))
c0=alpha*alpha
a1=2*(1-alpha)
a2=-(1-alpha)*(1-alpha)
elsif type=4 then //Bandstop
beta=2.415*(1-cos(cycl))
gamma=1/cos(cycl*2*0.1)
alpha=gamma-sqrt(gamma*gamma-1)
c0=(1+alpha)/2
b1=-2*beta
b2=1
a1=beta*(1+alpha)
a2=-alpha
elsif type=5 then//SMA
c1=1/length
b0=1/length
a1=1
elsif type=6 then//EMA
alpha=2/(length+1)
b0=alpha
a1=1-alpha
elsif type=7 then//RMA
alpha=1/length
b0=alpha
a1=1-alpha
endif
//----------------------------------------//
//Mean Reversion Channel
//----------------------------------------//
condition=0
//Mean Range
if barindex<=3 then
meanrange=sc1*tr+sc2*tr[1]+sc3*tr[2]
else
meanrange=sc1*tr+sc2*meanrange[1]+sc3*meanrange[2]
endif
//Mean Line
if type=1 then
if barindex<=3 then
meanline=sc1*source+sc2*source[1]+sc3*source[2]
else
meanline=sc1*source+sc2*meanline[1]+sc3*meanline[2]
endif
else
if barindex<=length then
meanline=source
else
meanline=(c0*((b0*source)+(b1*source[1]))+b2*source[2])+a1*meanline[1]+a2*meanline[2]-c1*source[length]
endif
endif

//Upper and lower bands
if drawchannel and barindex>length then
mymeanline=meanline
upband1=meanline+meanrange*mult
loband1=meanline-meanrange*mult
upband2=meanline+meanrange*mult2
loband2=meanline-meanrange*mult2
else
mymeanline=undefined
upband1=undefined
loband1=undefined
upband2=undefined
loband2=undefined
endif

//check condition
if close > mymeanline then
upband21=upband2+meanrange*gradsize*4
upband29=upband2-meanrange*gradsize*4
if high>=upband29 and high<upband2 then
condition=1
elsif high>=upband2 and high<upband21 then
condition=2
elsif high>=upband21 then
condition=3
elsif close<=mymeanline+meanrange then
condition=4
else
condition=5
endif
elsif close < mymeanline then
loband21=loband2-meanrange*gradsize*4
loband29=loband2+meanrange*gradsize*4
if low<=loband29 and low>loband2 then
condition=-1
elsif low<=loband2 and low>loband21 then
condition=-2
elsif low<=loband21 then
condition=-3
elsif close>=mymeanline+meanrange then
condition=-4
else
condition=-5
endif
endif
//----------------------------------------//
//Draw channels
//----------------------------------------//
if displayzone and barindex>length then
//Upper channel
upband21=upband2+meanrange*gradsize*4
upband22=upband2+meanrange*gradsize*3
upband23=upband2+meanrange*gradsize*2
upband24=upband2+meanrange*gradsize*1
upband25=upband2+meanrange*gradsize*0
upband26=upband2-meanrange*gradsize*1
upband27=upband2-meanrange*gradsize*2
upband28=upband2-meanrange*gradsize*3
upband29=upband2-meanrange*gradsize*4
//Lower channel
loband21=loband2-meanrange*gradsize*4
loband22=loband2-meanrange*gradsize*3
loband23=loband2-meanrange*gradsize*2
loband24=loband2-meanrange*gradsize*1
loband25=loband2-meanrange*gradsize*0
loband26=loband2+meanrange*gradsize*1
loband27=loband2+meanrange*gradsize*2
loband28=loband2+meanrange*gradsize*3
loband29=loband2+meanrange*gradsize*4
colorbetween(upband21,upband22,255,0,0,zonetransp)
colorbetween(upband22,upband23,255,66,0,zonetransp)
colorbetween(upband23,upband24,255,93,0,zonetransp)
colorbetween(upband24,upband25,255,116,0,zonetransp)
colorbetween(upband25,upband26,255,151,0,zonetransp)
colorbetween(upband26,upband27,255,174,0,zonetransp)
colorbetween(upband27,upband28,255,197,0,zonetransp)
colorbetween(upband28,upband29,255,205,0,zonetransp)

colorbetween(loband21,loband22,255,0,0,zonetransp)
colorbetween(loband22,loband23,255,66,0,zonetransp)
colorbetween(loband23,loband24,255,93,0,zonetransp)
colorbetween(loband24,loband25,255,116,0,zonetransp)
colorbetween(loband25,loband26,255,151,0,zonetransp)
colorbetween(loband26,loband27,255,174,0,zonetransp)
colorbetween(loband27,loband28,255,197,0,zonetransp)
colorbetween(loband28,loband29,255,205,0,zonetransp)
else
//Upper channel
upband21=undefined
upband22=undefined
upband23=undefined
upband24=undefined
upband25=undefined
upband26=undefined
upband27=undefined
upband28=undefined
upband29=undefined
//Lower channel
loband21=undefined
loband22=undefined
loband23=undefined
loband24=undefined
loband25=undefined
loband26=undefined
loband27=undefined
loband28=undefined
loband29=undefined
endif
//----------------------------------------//
//Draw channels
//----------------------------------------//
if islastbarupdate and displayline then
drawsegment(barindex,upband1,barindex+20,upband1)coloured("green")
drawsegment(barindex,loband1,barindex+20,loband1)coloured("green")
drawsegment(barindex,upband2,barindex+20,upband2)coloured("red")
drawsegment(barindex,loband2,barindex+20,loband2)coloured("red")
endif
//----------------------------------------//
return mymeanline as "Mean" coloured("orange")style(line,2),upband1 as "R1" coloured("green")style(point),loband1 as "S1"coloured("green")style(point),upband2 as "R2"coloured("red"),loband2 as "S2" coloured("red")
