

Max Deviation indicator
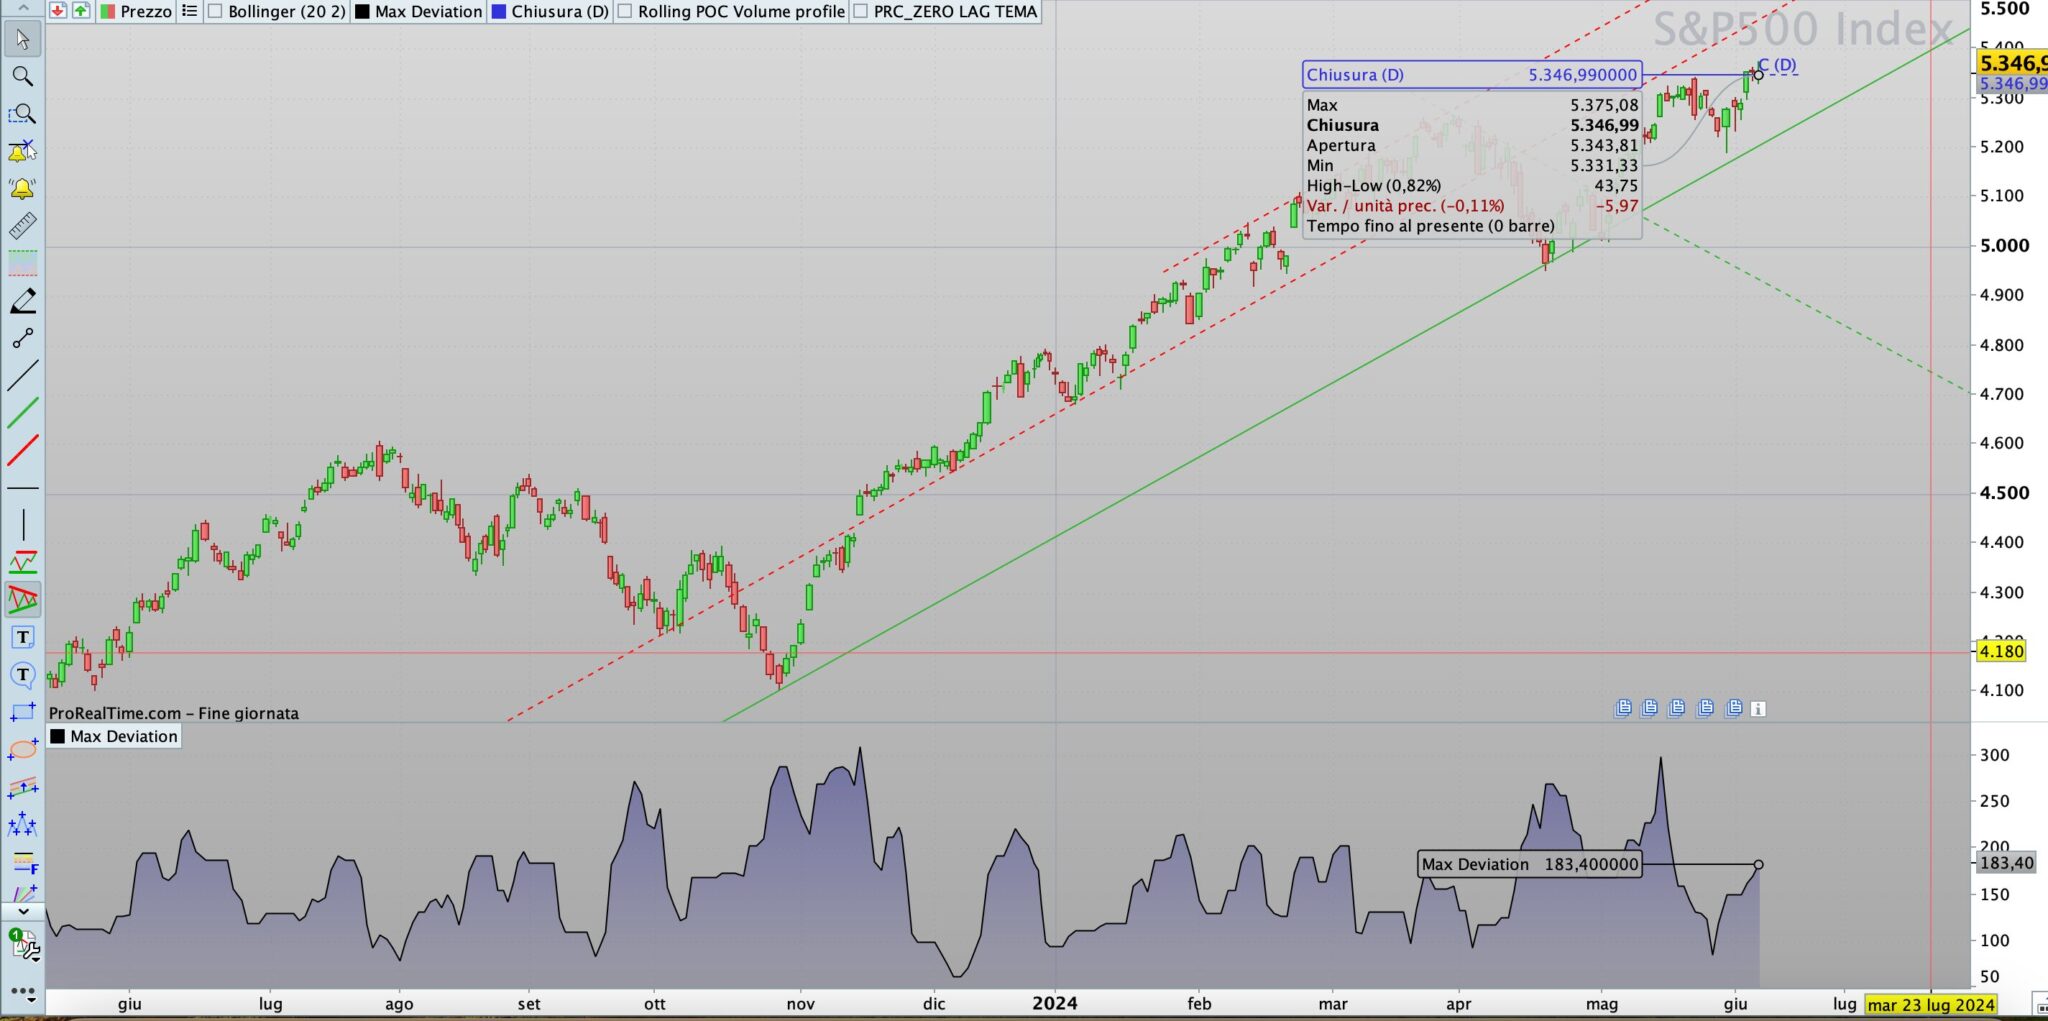
The Max Deviation indicator calculates the maximum deviation between the high and low of the last N days, providing a measure of volatility over a specified time period. This indicator can be used to identify areas of support and resistance, as well as to assess the volatility of a financial instrument.
Configuring the Indicator
To configure the Max Deviation indicator, it is necessary to set the length parameter, which represents the number of days over which the maximum deviation will be calculated. The value of length can be adjusted according to the specific needs of the trader, for example, 10, 20, or 50 days, depending on the desired period of analysis.
calculates the maximum deviation between the high and low of the last N days, providing a measure of volatility over a specified time period. This indicator can be used to identify areas of support and resistance, as well as to assess the volatility of a financial instrument.
To configure the Max Deviation indicator, it is necessary to set the length parameter, which represents the number of days over which the maximum deviation will be calculated. The value of length can be adjusted according to the specific needs of the trader, such as 10, 20, or 50 days, depending on the desired analysis period.
Configuration Example
If you wish to configure the indicator for a 20-day analysis, change the parameter line as follows:
// Impostazioni iniziali
DEFPARAM DrawOnLastBarOnly = True
DEFPARAM CalculateOnLastBars = 1000

// Parametro per il numero di giorni
length = 10

// Calcolo del massimo e del minimo degli ultimi N giorni
highMax = highest[length](high)
lowMin = lowest[length](low)

// Calcolo dello scostamento massimo
maxDeviation = highMax - lowMin

// Tracciare il risultato
RETURN maxDeviation AS "Max Deviation"
length = 20
This change will update the indicator to calculate the maximum deviation based on the last 20 days.