

Mastering Trends with Nicholas Darvas Boxes
In the golden age of trading, a professional dancer named Nicholas Darvas turned a $10,000 investment into over $2 million. He didn’t use complex algorithms or inside information; he used a unique method of tracking price action that is now legendary: The Darvas Box Theory.
Today, we are sharing a streamlined ProBuilder version of this indicator. This tool is essential for trend followers looking to capture significant market moves while managing risk effectively.
The Philosophy: Price in Motion
The core concept behind the Darvas Box is simple yet powerful. Darvas observed that stock prices do not move in straight lines. Instead, they move in a series of steps or “boxes.”
-
The Surge: Price rallies to a new high.
-
The Consolidation: Price retraces and fluctuates within a specific range, unable to break the previous high but holding above a certain low.
-
The Box: This high and low form the “ceiling” and “floor” of a Box.
-
The Breakout: When price breaks through the “ceiling” of the box, it signals a continuation of the trend and a buy signal.
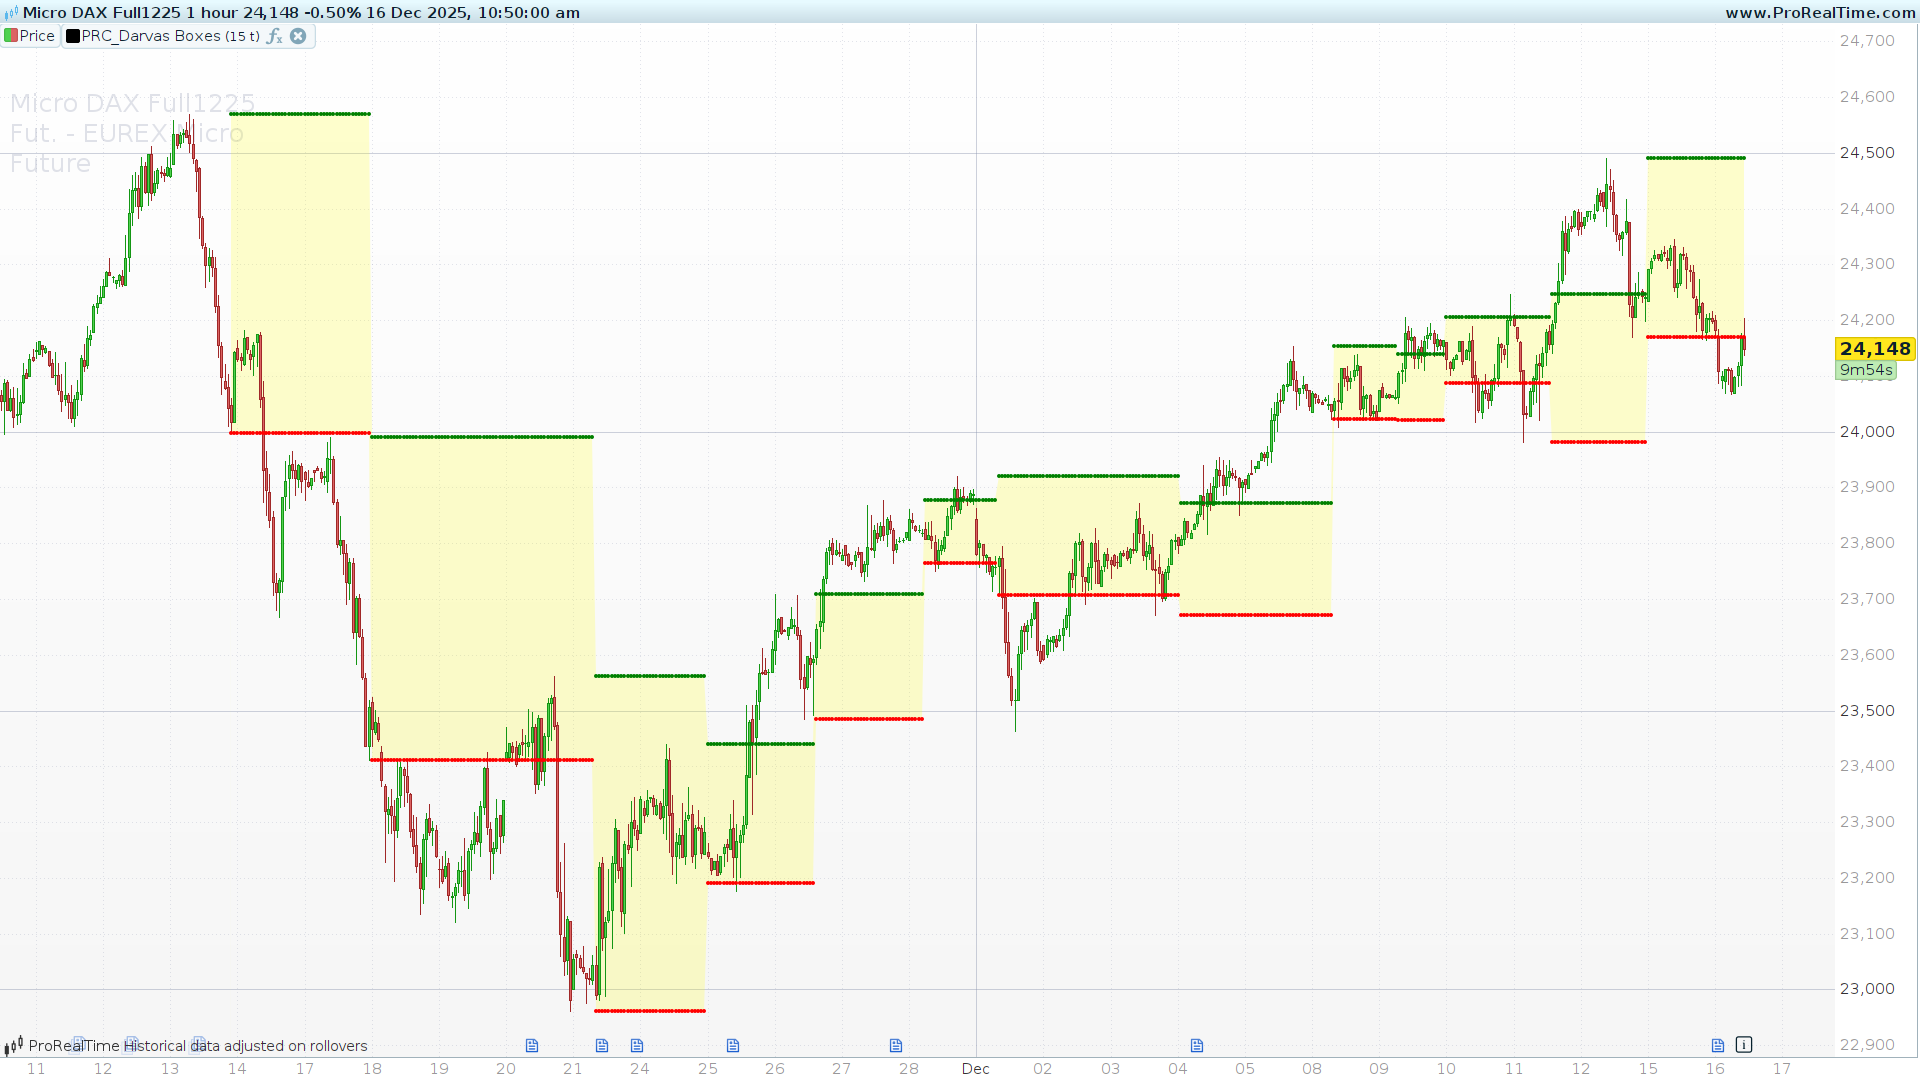
This indicator automates the detection of these consolidation periods, drawing the boxes directly on your chart, allowing you to visualize the “coiling” of price before the next explosive move.
How to Configure the Indicator
This version of the Darvas Boxes is designed to be lightweight and efficient. Here is how you can customize the settings in the ProRealTime properties window:
-
boxp(Default: 10): This represents the Box Period. It determines the sensitivity of the box construction.-
Lower values (e.g., 3-4): Will create more boxes and react faster to small consolidations. This is useful for scalping or very volatile markets but may produce more false signals.
-
Higher values (e.g., 10-14): Will filter out market noise and only draw boxes during significant consolidations. This is ideal for Swing Trading and longer-term trend following.
-
-
color(Default: 1): This is a simple toggle switch (Boolean).-
Set to
1(Checked): The indicator will fill the space between the Top and Bottom of the box with a yellow background, making it visually distinct. -
Set to
0(Unchecked): It will only plot the green (Top) and red (Bottom) dots, keeping your chart cleaner.
-
Note on Performance: The code includes the command defparam calculateonlastbars = 500. This ensures that ProRealTime only calculates the boxes for the most recent 500 candlesticks.
Trading Strategy: The Darvas Method
The Darvas Box is not just an indicator; it is a complete trading system. Here is how to apply it:
-
The Entry (The Breakout): When a candle closes above the green dotted line (the Top of the box), it indicates that the consolidation is over and the upward trend is resuming. This is your signal to enter a long position.
-
The Stop Loss: The red dotted line (the Bottom of the box) acts as a dynamic support level. Darvas famously used the bottom of the current box as his Stop Loss. If the price falls back into the box and breaks the floor, the trend is considered invalid.
-
Trailing the Trend: As price moves up and forms new boxes at higher levels, you manually move your Stop Loss up to the bottom of the new box. This allows you to ride the trend while securing profits along the way.
The Code
Copy and paste the following code into your ProRealTime indicator creation window.
//-------------------------------------------------//
//PRC_Darvas Boxes
//version = 0
//15.05.24
//Iván González @ www.prorealcode.com
//Sharing ProRealTime knowledge
//-------------------------------------------------//
//-----Inputs--------------------------------------//
defparam calculateonlastbars=500
boxp=5//Box Length
color=1//Color between top and bottom?
//-------------------------------------------------//
//-----High and Low Bands--------------------------//
ll=lowest[boxp](low)
k1=highest[boxp](high)
k2=highest[max(1,boxp-1)](high)
k3=highest[max(1,boxp-2)](high)
//-------------------------------------------------//
//-----New Highs Detection-------------------------//
if high>k1[1] then
   nh=high
else
   nh=nh
endif
//-------------------------------------------------//
//-----Top and Bottom definition-------------------//
box1=k3<k2
if barssince(high>k1[1])=(boxp-2) and box1 then
   topbox=nh
   bottombox=ll
else
   topbox=topbox
   bottombox=bottombox
endif
//-------------------------------------------------//
//-----Plotting------------------------------------//
drawpoint(barindex,topbox)coloured("green")
drawpoint(barindex,bottombox)coloured("red")
if color then
   colorbetween(topbox,bottombox,"yellow",50)
endif
//-------------------------------------------------//
return
