

MarketProfile indicator
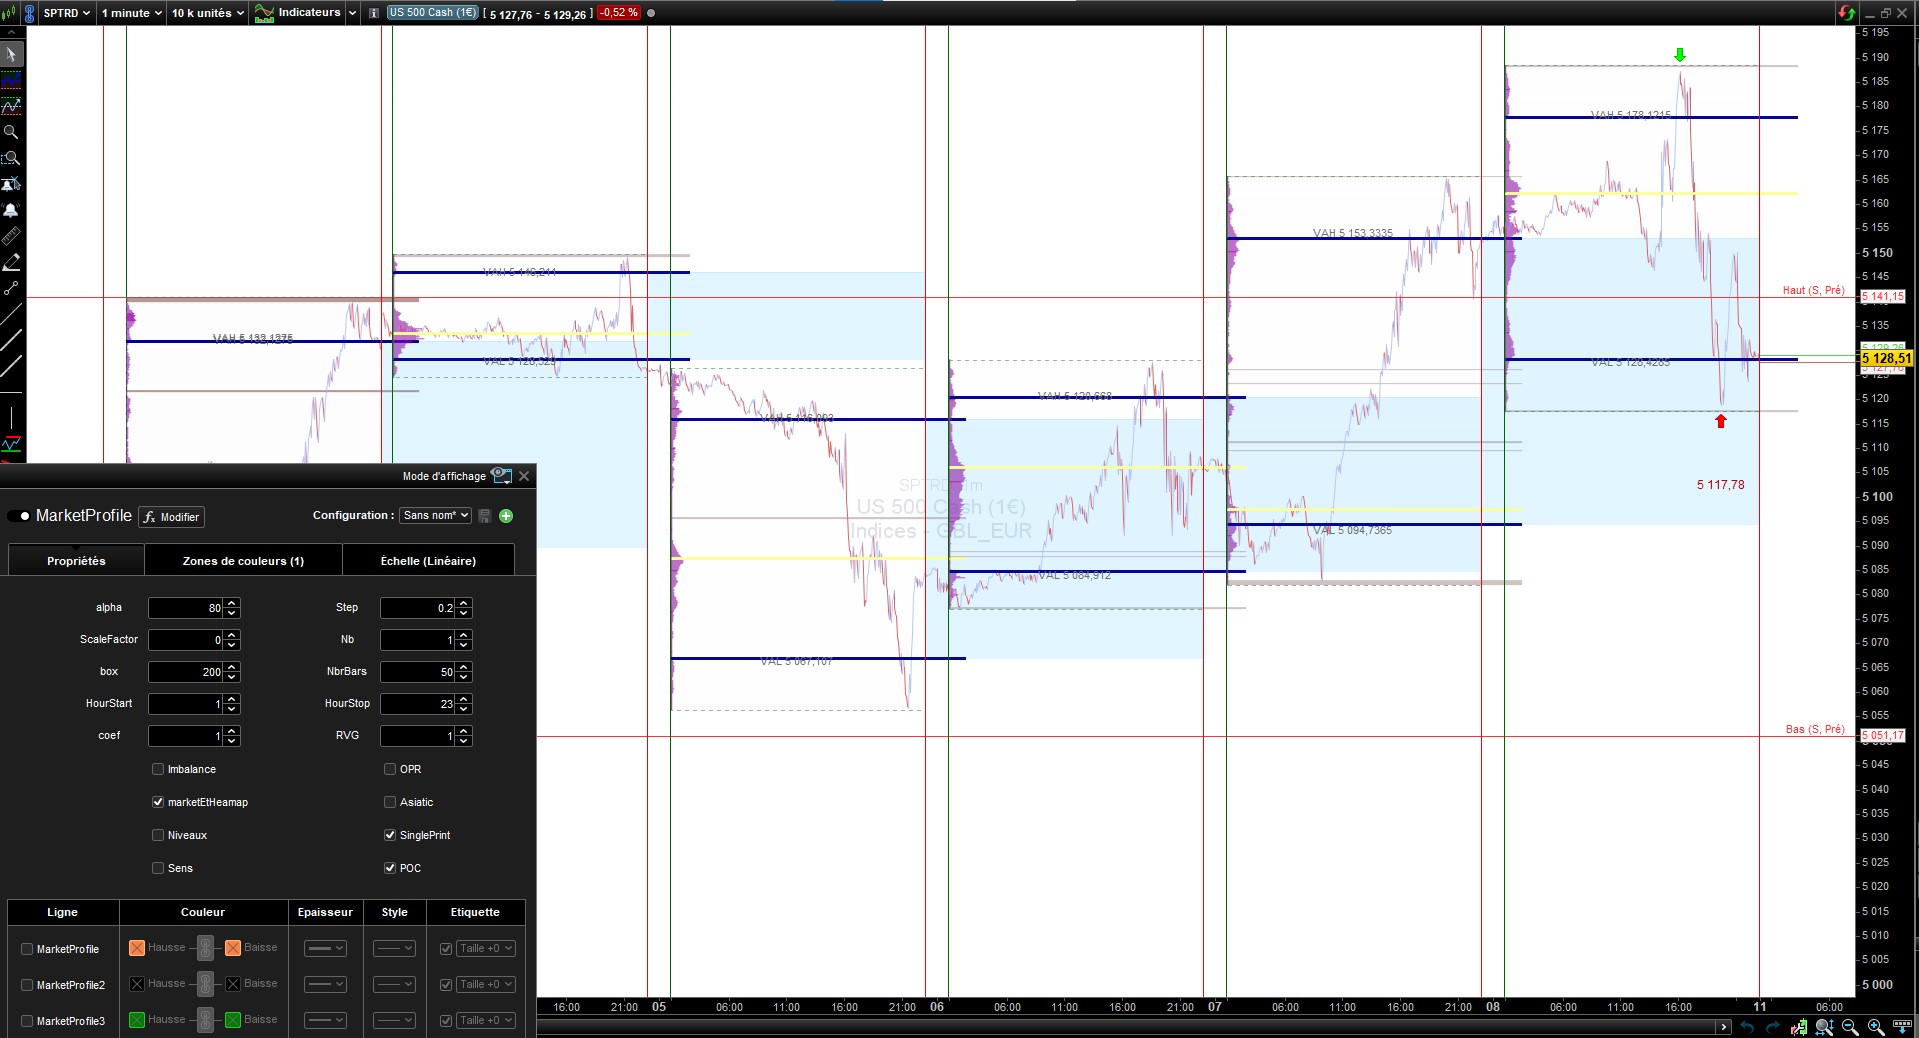
Marketprofile: This is a complex script with various functions, including volume profile calculation, market session detection (such as the Asian session), opening range breakout management, and much more.
It uses a combination of technical analysis methods such as ATR (Average True Range), VPOC (Volume Point of Control), VAH (Value Area High), VAL (Value Area Low) and draws various graphical elements on the chart for visualization such as rectangles, lines and arrows to highlight price levels or important events.
The code is structured with several control flow instructions (if-else, while loops) to analyze price and volume data at different times of the day, with the aim of identifying potential trading opportunities. It adjusts dynamically according to market activity and makes extensive use of variables and arrays to store and manipulate data throughout the trading session.
//defparam drawonlastbaronly=true
//HourStart=1
//HourStop=23
starttimeUS = 151500
endtimeUS = 153000
IB=061000
atr=AverageTrueRange[14](close)
dataOggi=date
debutL = 143000
finL = 153000

//ScaleFactor=20
//NbrBars=200

dataTemp=dataOggi
Conteggio=0
ValMinMaxFactor=1
Conteggio=0
valvolperc=0.7
once SelEnd=0
once SelStart=0
once CountDays=0
once PrezzoChiusura=0
once PrezzoApertura=0
once PrezzoLow=0
once PrezzoHigh=0
once ColoreSfondo=0
once LastStartBarIndex=0
once LastStopBarIndex=0
once LastPrezzoChiusura=0

//while CountDays=Maxdays do
Conteggio=Conteggio+1

if date[Conteggio]<> dataTemp then
CountDays=CountDays+1
SelEnd=0
SelStart=0
//PrezzoChiusura=0
endif

OraBarra=hour[Conteggio]
MinMaxFactor=ValMinMaxFactor*pipsize
DiffHigh=abs(high[1]-high[2])
DiffMin=abs(low[1]-low[2])

//MinutiBarra=minute[Conteggio]

if OraBarra=HourStart and SelStart=0 then

DRAWVLINE(Barindex[Conteggio])Coloured(0,100,0)

if Close[conteggio]>PrezzoChiusura then
//Green
R=127
G=255
B=0

else
R=255
G=0
B=0

endif

//DRAWRECTANGLE(Barindex[Conteggio],Close[conteggio],Barindex,PrezzoChiusura) Coloured(R,G,B)
//DRAWTEXT("GAP", barindex, (Close[conteggio]+PrezzoChiusura)/2)

DayStart=day
MonthStart=month
if DayStart and MonthStart then

endif

PrezzoApertura=open[Conteggio]
SelStart=1
ColoreSfondo=0

LastStartBarIndex=barindex
//DisegnaLariga
endif

if OraBarra=HourStop and SelEnd=0 then
PrezzoChiusura=close[Conteggio]

DayStop=day
MonthStop=month
//Calcolo POC

StopLookback=barindex-LastStartBarIndex
hh=highest[StopLookback](high)
ll=lowest[StopLookback](low)
op=open
div = (hh-ll)/NbrBars
i=0
volsum=summation[StopLookback](volume)
startbar = barindex[StopLookback]
maxbar = 0
checkprice = ll
MaxTouch1 = 0
//step = 10
while i<NbrBars do
lrange=ll+div*i
hrange=lrange+div
volbull=0
volbear=0
ij=1
ind=0 //reset index of array
//for ij = 1 to StopLookback do
while ij<=StopLookback do
j=ij
if close[j]>=lrange and close[j]<=hrange then
if close[j]>open[j] then
volbull=volbull+volume[j]
else
volbear=volbear+volume[j]
endif
endif
ij=ij+1
wend
//next

bullbar = round((volbull*StopLookback)/volsum)*scalefactor
bearbar = round((volbear*StopLookback)/volsum)*scalefactor
if marketEtHeamap=1 then

drawrectangle(startbar,lrange,startbar+bullbar,hrange) coloured(46,139,87,alpha)bordercolor(46,139,87,1)
drawrectangle(startbar,lrange,startbar+bearbar,hrange) coloured(255,0,0,alpha)bordercolor(250,0,0,1)
endif

if bullbar>bearbar then
RPoc=46
GPoc=139
BPoc=87
else
RPoc=255
GPoc=0
BPoc=0
endif

if(bullbar>maxbar) then
vpoclevel = (lrange+hrange)/2
maxbar=bullbar
endif
if(bearbar>maxbar) then
vpoclevel = (lrange+hrange)/2
maxbar=bearbar
endif

i=i+1
wend

while checkprice<=hh do
touch=0 //reset price touch for this price level
for i = 0 to StopLookback-1 do
if high[i]>=checkprice and low[i]<=checkprice then
touch=touch+1
$hm[ind] = touch
endif
next
if $hm[ind] > MaxTouch1 then
MaxTouch1 = $hm[ind]
MaxTouch2 = checkprice
endif
//define color
CL=(hh+ll)/2
StdDev = (hh- ll) / 2
VX=0.7
VAH=CL + StdDev *vx
VAL=CL - StdDev * vx
g=rvg
b=210

r = min($hm[ind]*12,g)
//plot the result
//drawtext("█",startbar,checkprice) coloured(r,0,0)

if marketEtHeamap=1 then

//drawtext("#touch#",startbar-step*3,checkprice) coloured(110,110,110)
if sens=1 then
drawrectangle(startbar-touch*coef/(1),(checkprice-step/2),startbar,checkprice+step/2)coloured(0,r,50,alpha)bordercolor(210,r,210,50)
else
drawrectangle(startbar-touch*coef/(-1),(checkprice-step/2),startbar,checkprice+step/2)coloured(0,r,50,alpha)bordercolor(210,r,210,50)
endif
endif
if singlePrint=1 then
if touch<=1 then
drawrectangle(startbar,checkprice-step/2,Barindex[Conteggio]+box,checkprice+step/2)coloured(110,110,110,alpha)bordercolor(200,r,0,10)
endif
endif
checkprice=checkprice+step //increase price check for next round
ind=ind+1 //increase array index

wend
// Affichage de VAH et VAL

//DRAWsegment(startbar, MaxTouch2[1], Barindex[Conteggio]+box, MaxTouch2[1]) coloured(r,0,150,250)style(dottedline,2)
DRAWsegment(startbar, vpoclevel, Barindex[Conteggio]+box, vpoclevel) coloured(250,50,0,100)style(line,3)
DRAWsegment(startbar, vpoclevel[1], Barindex[Conteggio]+box, vpoclevel[1]) coloured(250,50,0,100)style(dottedline,2)

if Poc=1 then
bar=startbar-(startbar-Barindex[Conteggio])/2
DRAWsegment(startbar, MaxTouch2, Barindex[Conteggio]+box, MaxTouch2) coloured(250,2500,150,250)style(line,3)
DRAWsegment(startbar, VAH, Barindex[Conteggio]+box, VAH) coloured(r,0,150,250)style(line,3)
DRAWsegment(startbar, VAL, Barindex[Conteggio]+box, VAL) coloured(r,0,150,250)style(line,3)
drawtext("VAH #VAH#",bar,VAH+atr) coloured(110,110,110)
drawtext("VAL #VAL#",bar,VAL-atr) coloured(110,110,110)
drawrectangle(startbar,hh,Barindex[Conteggio],ll) coloured(0,0,0,1)bordercolor(46,139,87,150)style(DOTTEDLINE ,1)

endif

if niveaux=1 then
yesterdayVPOC=vpoclevel[1]
DRAWsegment(startbar, MaxTouch2, Barindex[Conteggio]+box, MaxTouch2) coloured(250,2500,150,250)style(line,3)
drawtext(" #DayStop#/#MonthStop# VPOC [#yesterdayVPOC#]",BarIndex,vpoclevel[2],dialog,bold,10) coloured(0,0,0)
DRAWTEXT(" #DayStart#/ #MonthStart# Close", barindex+box, PrezzoChiusura+(2*pipsize))
DRAWTEXT(" #DayStart#/ #MonthStart# Open", barindex+box, PrezzoApertura+(2*pipsize))

DRAWTEXT(" #DayStart#/ #MonthStart# High", barindex+box, hh)Coloured(255,0,255)
DRAWTEXT(" #DayStart#/ #MonthStart# Low", barindex+box, ll)Coloured(255,0,255)

drawrectangle(startbar-1, PrezzoApertura,startbar+1, PrezzoChiusura) coloured(255,55,150,250) bordercolor(210,210,210,50)

DRAWARROW (startbar-2, PrezzoApertura) COLOURED (255, 0, 0)
DRAWSEGMENT(startbar,PrezzoChiusura,Barindex[Conteggio]+box,PrezzoChiusura) Coloured(255,0,0)
DRAWSEGMENT(startbar,PrezzoApertura,Barindex[Conteggio]+box,PrezzoApertura) Coloured(100,75,22)

DRAWSEGMENT(startbar,hh,Barindex[Conteggio]+box,hh) Coloured(255,0,255)
DRAWSEGMENT(startbar,ll,Barindex[Conteggio]+box,ll) Coloured(255,0,255)
//endif
endif

SelEnd=1

DRAWVLINE(Barindex[Conteggio]) Coloured(255,0,0)
ColoreSfondo=1
LastStopBarIndex=barindex

//DisegnaLariga
endif

debutN = 153000
finN = 154500

// TRACE DU RECTANGLE DE L'OPR US

IF time = debutN THEN
hautN = 0
basN = 0
barredebutN = barindex
ENDIF

IF time = finN THEN
barrefinN = barindex
ENDIF

IF time >= debutN AND time <= finN THEN
IF high > hautN THEN
hautN = high

ENDIF
IF low < basN OR time = debutN THEN
basN = low
ENDIF
difN = round(abs(hautN-basN))
ENDIF
if opr=1 then
IF time >= finN THEN
DrawText(" OPR H #difn#pts",barredebutN,hautN+4*pointsize,Dialog,Bold,10) coloured(0,0,0,250)
DrawText(" OPR B",barredebutN,basN+4*pointsize,Dialog,Bold,10) coloured(0,0,0,250)
drawsegment(barredebutN,hautN,Barindex[Conteggio],hautN) coloured(0,0,0,50) STYLE (dottedline,2)
DRAWRECTANGLE(barredebutN,hautN,barrefinN,basN) coloured(0,0,255,Alpha)bordercolor(0,0,255,Alpha)
drawsegment(barredebutN,basN,Barindex[Conteggio],basN) coloured(0,0,0,50) STYLE (dottedline,2)
ENDIF
endif
// heures de session
debut = 010000
fin = 090000

// TRACE DU RECTANGLE DE SESSION ASIATIQUE

IF time = debut THEN
haut = 0
bas = 0
barredebut = barindex
ENDIF

IF time = fin THEN
barrefin = barindex
ENDIF

IF time >= debut AND time <= fin THEN
IF high > haut THEN
haut = high

ENDIF
IF low < bas OR time = debut THEN
bas = low
ENDIF
dif = round(abs(haut-bas))
ENDIF
if Asiatic=1 then
IF time >= fin THEN
DrawText(" Haut asiatique #dif#pts",barredebut,haut+4*pointsize,Dialog,Bold,10) coloured(0,0,0,250)
DrawText(" Bas asiatique",barredebut,bas+4*pointsize,Dialog,Bold,10) coloured(0,0,0,250)
drawsegment(barredebut,haut,Barindex[Conteggio],haut) coloured(0,0,0,50) STYLE (dottedline,2)
DRAWRECTANGLE(barredebut,haut,barrefin,bas) coloured(255,255,0,50)bordercolor(255,255,0,1)
drawsegment(barredebut,bas,Barindex[Conteggio],bas) coloured(0,0,0,50) STYLE (dottedline,2)
ENDIF
endif

if IsLastBarUpdate then

For j = 1 To nb do

for i = 1 To StopLookback-1 do

IF High[StopLookback*(j-1)+i]=hh[(j-1)*StopLookback] Then

//hh=High[StopLookback*(j-1)+i]
HighestI = BarIndex[StopLookback*(j-1)+i]
DRAWTEXT(hh[(j-1)*StopLookback], HighestI, hh[(j-1)*StopLookback]+15, Dialog, Standard, 12) COLOURED(0,255,0)
DRAWARROWDOWN(HighestI,hh[(j-1)*StopLookback]+2) COLOURED(0,255,00)

endif
IF Low[StopLookback*(j-1)+i]=ll[(j-1)*StopLookback] Then
//ll=Low[StopLookback*(j-1)+i]
LowestI = BarIndex[StopLookback*(j-1)+i]
DRAWTEXT(ll[(j-1)*StopLookback], LowestI, ll[(j-1)*StopLookback]-15, Dialog, Standard, 12) COLOURED(200,0,0)
DRAWARROWUP(LowestI,ll[(j-1)*StopLookback]-2) COLOURED(255,0,00)

endif

next
next

endif
// TRACE DU RECTANGLE IB

IF time = debutL THEN
hautL = 0
basL = 0
barredebutL = barindex
ENDIF

IF time = finL THEN
barrefinL = barindex
ENDIF

IF time >= debutL AND time <= finL THEN
IF high > hautL THEN
hautL = high

ENDIF
IF low < basL OR time = debutL THEN
basL = low
ENDIF
difL = round(abs(hautL-basL))
ENDIF
if imbalance=1 then
if time=IB then
barIB=barindex
endif
IF time >= finL THEN
DrawText("Haut Imbalance #difL#pts",barIB+40,hautL+0.4,Dialog,Bold,10) coloured(0,0,0,250)
DrawText("Bas Imbalance",barIB+40,basL+0.4,Dialog,Bold,10) coloured(0,0,0,250)
drawsegment(barIB,hautL,Barindex[Conteggio],hautL) coloured(0,255,0,Alpha) STYLE (dottedline,1)
DRAWRECTANGLE(barIB-1,hautL,barIB+1,basL) coloured(250,255,0,Alpha)bordercolor(0,255,0,1)
drawsegment(barIB,basL,Barindex[Conteggio],basL) coloured(0,255,0,Alpha) STYLE (dottedline,1)
drawrectangle(barredebutL, hautL,barrefinL, basL) coloured(255,255,150,60) bordercolor(210,210,210,50)
ENDIF
endif

RETURN MaxTouch2,VAH,VAL