

Market Structure Trend Matrix
Most trend-following overlays answer only one question: which side of the market should I be on? The Market Structure Trend Matrix, originally by BigBeluga, answers three at once: it detects the moment the market structure flips (Change of Character, or ChoCh), it manages the position with an ATR trailing stop, and it projects a ladder of profit targets that keeps extending for as long as the trend delivers.
The result reads like a Supertrend with a market-structure brain: instead of flipping on a volatility band cross, direction only changes when price closes through the last confirmed swing pivot — a structural event rather than a statistical one.
Theory Behind the Indicator
Market structure and the ChoCh
The indicator tracks swing pivots: a pivot high is a bar whose high is the highest within msLen bars on each side (10 by default), and symmetrically for pivot lows. Pivots are confirmed msLen bars after they print — the standard lookback/lookahead definition.
While the structure is bearish, the indicator watches the last confirmed pivot high. When a candle closes above it, the character of the market has changed: a bullish ChoCh fires. The broken pivot level is drawn as a horizontal line from the pivot bar to the breakout bar, labelled “ChoCh ↑”. The mirror logic applies to bearish flips through the last pivot low.
Because direction is a two-state machine (the bullish trigger is only armed while structure is bearish, and vice versa), each structural flip fires exactly once — no repeated signals while price oscillates around the level.
ATR trailing stop
On every bullish ChoCh the trailing stop is seeded at close − ATR(14) × 4 and from then on can only rise: max(previous stop, close − ATR × multiplier). It never loosens, and it resets to a fresh level on the next flip. The area between price and the stop is filled with the trend colour, so chart reading is immediate: green canvas, bullish structure; magenta canvas, bearish.
Note that the stop is informational — the indicator flips direction on the opposite ChoCh, not on a stop touch. The stop tells you where the trend would be invalidated in volatility terms; the structure tells you when it actually is.
Cascading (“infinite”) targets
At the moment of a bullish ChoCh, the entry reference is the broken pivot level and the first target is placed at entry + ATR × targetStep (2 ATRs by default). When the high touches the target, the level is frozen as a dotted line from the start of the trend to the bar that hit it, labelled with the percentage gained from entry — and the next target is projected one ATR step higher. There is no limit: a strong trend keeps printing +2.3%, +4.1%, +6.0%… while the ladder climbs. The mechanism is symmetric for downtrends.
This converts the eternal “where do I take profits?” question into a measurable ladder, and the chart history into a record of how far each structural trend actually travelled.
How to Read the Indicator
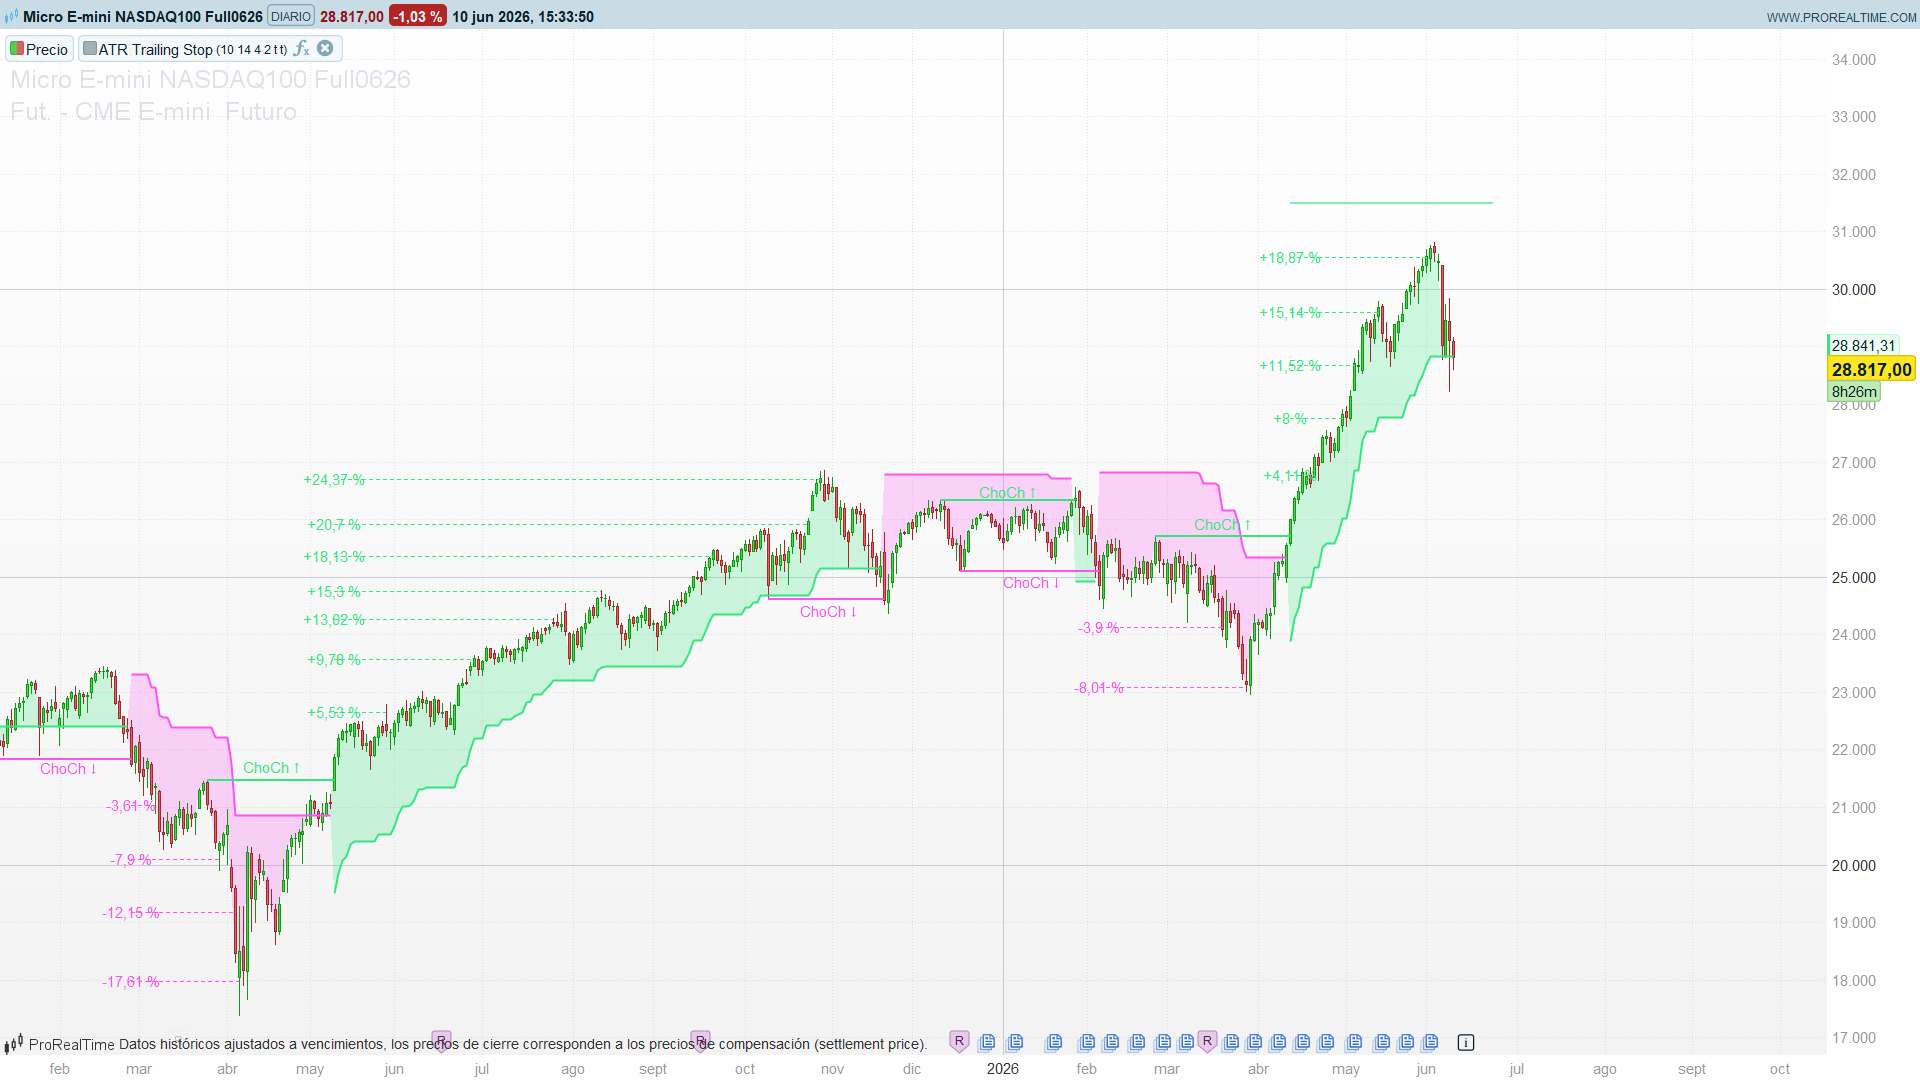
- ChoCh lines and labels mark every structural flip: a green horizontal segment at the broken pivot high (“ChoCh ↑”), magenta at the broken pivot low (“ChoCh ↓”). The line spans from the pivot bar to the breakout bar, so its length tells you how old the broken structure was.
- The trailing stop is the thick coloured line riding below (bullish) or above (bearish) the price, with the translucent fill in between. A widening gap between price and stop signals an accelerating trend.
- The active target is the horizontal line projected ten bars ahead of the last candle. Solid right after a ChoCh, slightly translucent once the first targets have been consumed.
- Hit targets stay on the chart as dotted lines with their percentage labels stacked at the trend origin — an instant visual census of how productive each trend was.
Practical Applications
- Trend filter with structural logic. Use the direction (colour) as a regime filter for other strategies: longs only while the structure is bullish. Unlike a moving-average filter, it only flips on confirmed pivot breaks.
- Position management. The ATR trailing stop gives a volatility-scaled invalidation level that never loosens; the target ladder offers objective partial-profit levels (e.g. scale out a third at each rung).
- Trend quality audit. The percentage labels accumulated at each trend origin show how far past trends ran before flipping — useful for calibrating expectations (and
targetStepMult) per instrument and timeframe. - Confluence with S/R. A ChoCh that breaks a pivot aligned with a higher-timeframe level is a far stronger signal than one inside chop. The drawn pivot line makes that check trivial.
Indicator Configuration
| Parameter | Default | Description |
|-----------|---------|-------------|
| `msLen` | 10 | Pivot lookback/lookahead for market structure |
| `atrLength` | 14 | ATR period for stop and target spacing |
| `atrMult` | 4.0 | ATR multiplier for the trailing stop distance |
| `targetStepMult` | 2.0 | Vertical distance between consecutive targets (× ATR) |
| `showHistory` | 1 | Draw the already-hit targets and their % labels |
| `showStop` | 1 | Draw the trailing stop line and the fill |
Code
//----------------------------------------------
// PRC_Market Structure Trend Matrix
// version = 0
// 10.06.26
// Iván González @ www.prorealcode.com
//Original author: BigBeluga
//Sharing ProRealTime knowledge
//----------------------------------------------
// === Parametros (exponer como variables del indicador) ===
//----------------------------------------------
msLen = 10           // longitud de estructura (pivots: lookback y lookahead)
atrLength = 14       // periodo del ATR
atrMult = 4.0        // multiplicador ATR del trailing stop
targetStepMult = 2.0 // distancia entre targets consecutivos (x ATR)
showHistory = 1      // 1 = dibujar los targets ya alcanzados
showStop = 1         // 1 = dibujar trailing stop + relleno
//----------------------------------------------
// === Colores (alcista verde / bajista magenta) ===
//----------------------------------------------
bullR = 52
bullG = 230
bullB = 126
bearR = 255
bearG = 82
bearB = 241
//----------------------------------------------
myAtr = averagetruerange[atrLength]
pivotWindow = 2 * msLen + 1

once direction = 0   // 0 = estructura bajista, 1 = alcista
once started = 0     // 1 tras el primer ChoCh
once phVal = 0
once plVal = 0
once phIndx = 0
once plIndx = 0
once phReady = 0
once plReady = 0
once atrTS = 0
once entryPrice = 0
once currentTarget = 0
once trendStart = 0
once hitCount = 0
//----------------------------------------------
// === Deteccion de pivots (confirmados msLen barras tarde) ===
//----------------------------------------------
if barindex > 2 * msLen then
   if high[msLen] >= highest[pivotWindow](high) then
      phVal = high[msLen]
      phIndx = barindex - msLen
      phReady = 1
   endif
   if low[msLen] <= lowest[pivotWindow](low) then
      plVal = low[msLen]
      plIndx = barindex - msLen
      plReady = 1
   endif
endif
//----------------------------------------------
// === ChoCh alcista: cierre cruza el ultimo pivot high en estructura bajista ===
//----------------------------------------------
if phReady = 1 and direction = 0 and close crosses over phVal then
   direction = 1
   started = 1
   hitCount = 0
   atrTS = close - myAtr * atrMult
   entryPrice = phVal
   currentTarget = entryPrice + myAtr * targetStepMult
   trendStart = barindex
   labelX = round((phIndx + barindex) / 2)
   drawsegment(phIndx, phVal, barindex, phVal) coloured(bullR, bullG, bullB) style(line, 2)
   drawtext("ChoCh ↑", labelX, phVal + myAtr * 0.4) coloured(bullR, bullG, bullB)
endif
//----------------------------------------------
// === ChoCh bajista: cierre cruza el ultimo pivot low en estructura alcista ===
//----------------------------------------------
if plReady = 1 and direction = 1 and close crosses under plVal then
   direction = 0
   started = 1
   hitCount = 0
   atrTS = close + myAtr * atrMult
   entryPrice = plVal
   currentTarget = entryPrice - myAtr * targetStepMult
   trendStart = barindex
   labelX = round((plIndx + barindex) / 2)
   drawsegment(plIndx, plVal, barindex, plVal) coloured(bearR, bearG, bearB) style(line, 2)
   drawtext("ChoCh ↓", labelX, plVal - myAtr * 0.4) coloured(bearR, bearG, bearB)
endif
//----------------------------------------------
directionChange = 0
if started = 1 and direction <> direction[1] then
   directionChange = 1
endif
//----------------------------------------------
// === Trailing stop + cascada de targets ===
//----------------------------------------------
if started = 1 then
   if direction = 1 then
      atrTS = max(atrTS, close - myAtr * atrMult)
      if high >= currentTarget then
         if showHistory = 1 then
            perc = round((currentTarget - entryPrice) / entryPrice * 10000) / 100
            drawsegment(trendStart, currentTarget, barindex, currentTarget) coloured(bullR, bullG, bullB) style(dottedline, 1)
            drawtext("+#perc#%", trendStart, currentTarget) coloured(bullR, bullG, bullB)
         endif
         currentTarget = currentTarget + myAtr * targetStepMult
         hitCount = hitCount + 1
      endif
   else
      atrTS = min(atrTS, close + myAtr * atrMult)
      if low <= currentTarget then
         if showHistory = 1 then
            perc = round((currentTarget - entryPrice) / entryPrice * 10000) / 100
            drawsegment(trendStart, currentTarget, barindex, currentTarget) coloured(bearR, bearG, bearB) style(dottedline, 1)
            drawtext("#perc#%", trendStart, currentTarget) coloured(bearR, bearG, bearB)
         endif
         currentTarget = currentTarget - myAtr * targetStepMult
         hitCount = hitCount + 1
      endif
   endif
else
   atrTS = close   // antes del primer ChoCh: pegado al precio (alpha 0, no distorsiona escala)
endif
//----------------------------------------------
// === Target activo: solo en la ultima barra, proyectado 10 barras ===
//----------------------------------------------
if islastbarupdate and started = 1 then
   if hitCount = 0 then
      activeAlpha = 255
   else
      activeAlpha = 153
   endif
   if direction = 1 then
      drawsegment(trendStart, currentTarget, barindex + 10, currentTarget) coloured(bullR, bullG, bullB, activeAlpha) style(line, 2)
   else
      drawsegment(trendStart, currentTarget, barindex + 10, currentTarget) coloured(bearR, bearG, bearB, activeAlpha) style(line, 2)
   endif
endif
//----------------------------------------------
// === Color + visibilidad del trailing stop (alpha toggle) ===
//----------------------------------------------
if direction = 1 then
   r = bullR
   g = bullG
   b = bullB
else
   r = bearR
   g = bearG
   b = bearB
endif

stopAlpha = 255
if showStop = 0 or started = 0 or directionChange = 1 then
   stopAlpha = 0
endif

areaAlpha = 60
if showStop = 0 or started = 0 then
   areaAlpha = 0
endif

colorbetween(close, atrTS, r, g, b, areaAlpha)
//----------------------------------------------
return atrTS as "ATR Trailing Stop" coloured(r, g, b, stopAlpha) style(line, 2)
