

Market Structure RSI — An RSI Computed on Pivot Break Counts
Introduction
The classical RSI is computed on bar-to-bar price changes. The Market Structure RSI takes a different approach: instead of feeding RSI with raw price returns, it feeds it with a series that counts how many recent swing highs price has broken above (positive contribution) and how many recent swing lows price has broken below (negative contribution). The RSI formula is then applied to that running count.
The result is an oscillator that does not respond to every tick of price action, but to the structural events of the market — the moments when price actually breaks meaningful pivots. When it pushes towards 100 the market has been making higher highs by repeatedly violating swing highs; when it sinks towards 0 the market has been taking out swing lows. Around 50 the structural picture is balanced.
Theory Behind the Indicator
Pivot detection
A 3-bar pivot is the simplest possible structural marker:
- A pivot high occurs when the high of bar [2] is greater than both high[3] and high[1].
- A pivot low occurs when the low of bar [2] is lower than both low[3] and low[1].
Each new pivot is appended to a list with its price and bar index. The result is a chronological catalogue of recent structural turning points, growing one entry at a time.
Counting structural breaks
On every bar the indicator scans the most recent pivots from newest to oldest:
- If price (using either the previous bar’s high or its close, depending on configuration) trades above a stored pivot high, that pivot is marked as broken and a +1 is registered. The scan continues to the next older pivot until it finds one that has not yet been violated.
- Symmetrically, if price trades below a stored pivot low, a -1 is registered and the scan continues.
A single bar can therefore break several pivots in cascade — a strong impulsive move that takes out three previous pivot highs in one go contributes +3 to the count, while a quiet bar in the middle of a range contributes nothing.
From count to RSI
The cumulative break-count series is fed into a standard RSI of length rsiLength. RSI takes the role it was designed for — measuring the relative weight of positive vs. negative changes over a window — but it now operates on structural events rather than on raw price changes. Optional moving-average smoothing on top of the RSI provides a slower confirmation line.
Key Features at a Glance
- Pivot-break-based oscillator bounded between 0 and 100.
- Selectable break criterion: previous bar’s high/low (more responsive) or previous bar’s close (more conservative).
- Optional moving average overlay on the RSI line, with several MA types selectable.
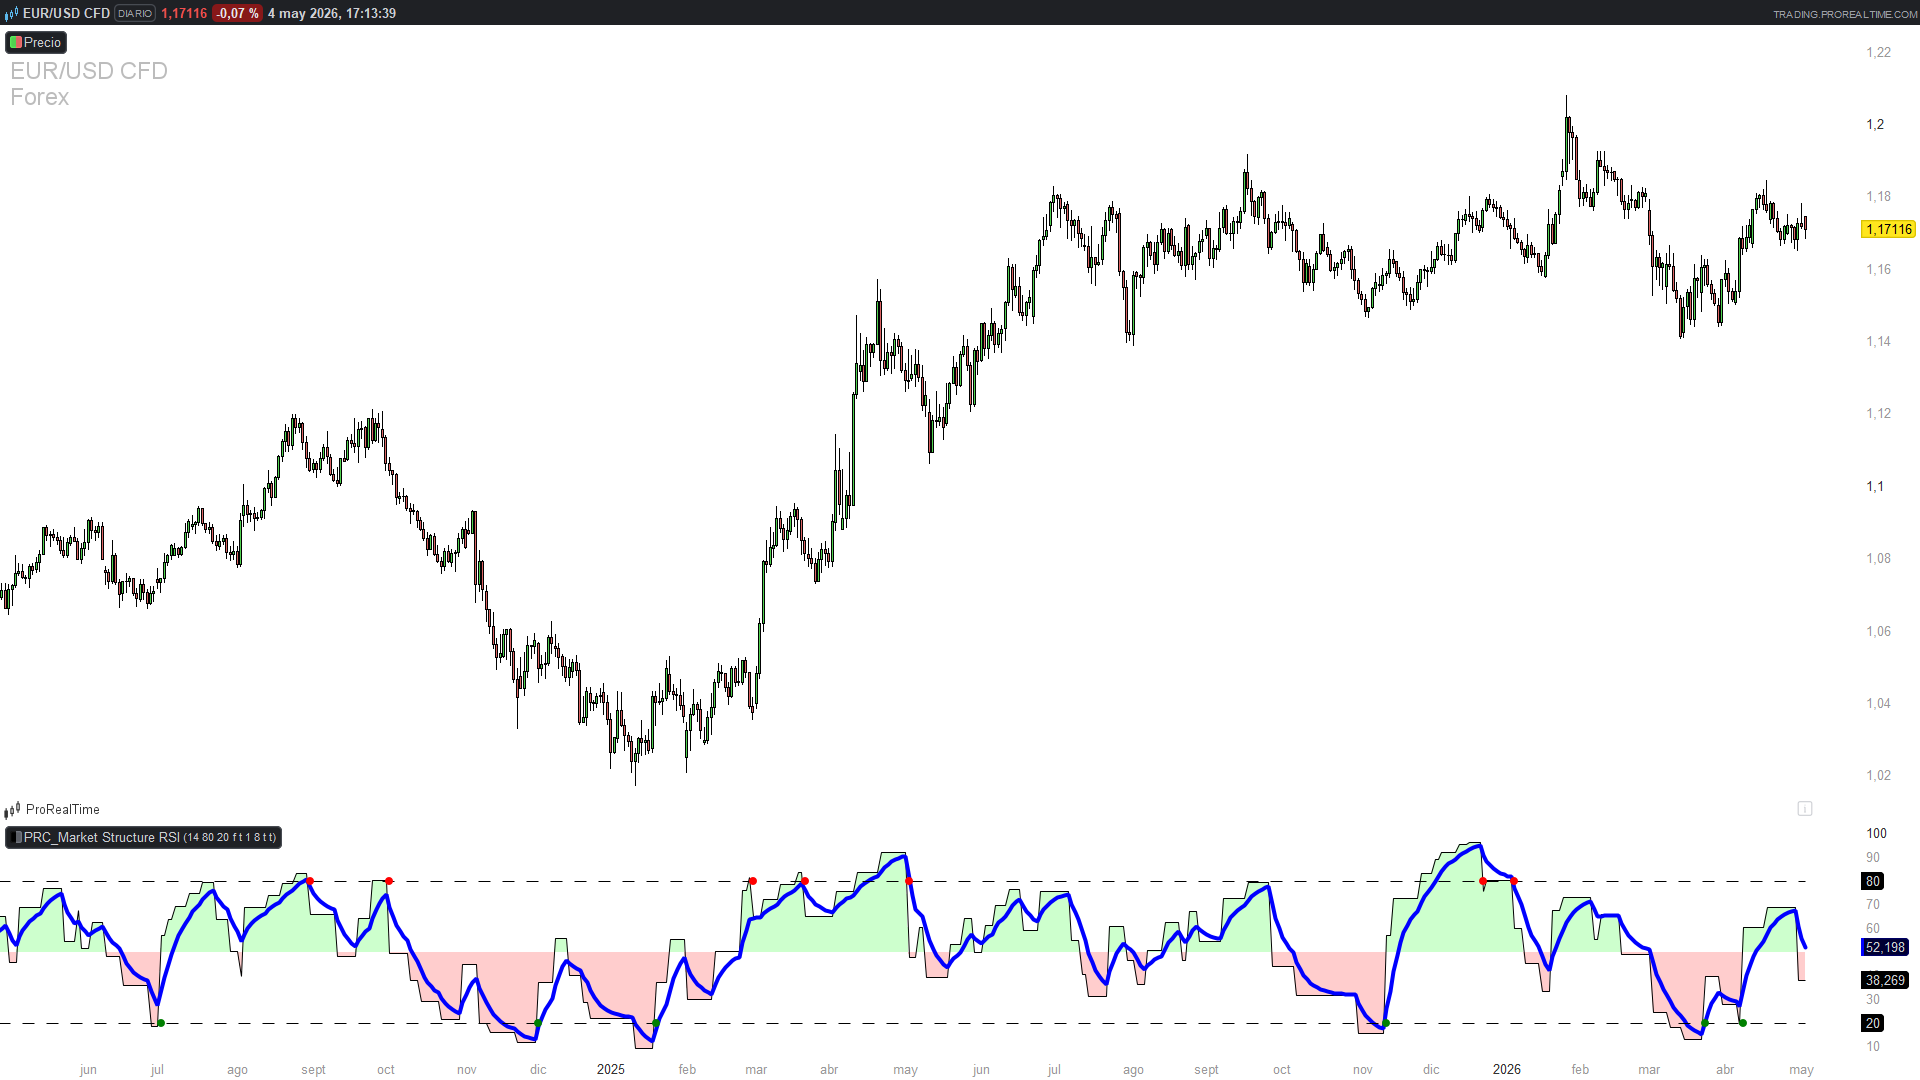
- Colour gradient that paints the histogram green above 50 and red below 50.
- Optional arrow signals on overbought and oversold crossings.
How to Read the Indicator
The Market Structure RSI is read like a classical RSI but with a structural meaning attached to each level:
- Above 50 — recent pivot highs are being broken faster than pivot lows. Underlying structure is bullish.
- Below 50 — recent pivot lows are being broken faster than pivot highs. Underlying structure is bearish.
- Above 80 (default OB) — sustained breaking of pivot highs. Bullish structure may be approaching exhaustion.
- Below 20 (default OS) — sustained breaking of pivot lows. Bearish structure may be approaching exhaustion.
- MA crossings — when the RSI crosses its own moving average, momentum at the structural level is changing.
Because the input is a count of structural events rather than continuous price, the oscillator tends to be less noisy than a standard RSI in choppy markets: as long as no pivots are broken, the count series stays flat and the RSI reverts towards 50.
Practical Applications
- Bias filter. Use the line’s position relative to 50 as a top-down structural filter. Take long setups only while the oscillator is above 50; short setups only below 50.
- Exhaustion fade. Crosses back below 80 from overbought, or back above 20 from oversold, are classic fade triggers — here they are anchored to actual pivot-break activity rather than to short-term price noise.
- Structural divergence. Compare the slope of the indicator with the slope of price. Price making a higher high while the Market Structure RSI fails to reach a new high suggests the rally is being driven by fewer and weaker pivot breaks — a warning of underlying weakness.
- Confirmation overlay. Combined with a trend filter such as a moving-average ribbon, the indicator confirms whether the trend is supported by genuine structure breaks or is purely a price drift inside a stable range.
- MA crossover system. Enabling the moving average and treating its crosses with the RSI line as triggers turns the indicator into a self-contained signal generator on a structural basis.
Indicator Configuration
- rsiLength (default: 20) — period of the RSI computed on the structural count series. Higher values produce a smoother, slower oscillator.
- OBlvl (default: 80) — overbought threshold used for colouring and signals.
- OSlvl (default: 20) — oversold threshold used for colouring and signals.
- strCloseType (default: 0) — break-detection rule. 0 uses the previous bar’s high (for upside breaks) and low (for downside breaks); 1 uses the previous bar’s close for both, which is more conservative.
- maBool (default: 1) — 1 plots the moving average of the RSI; 0 hides it.
- maSelection (default: 1) — moving-average type. 0 simple, 1 exponential, 2 weighted, 3 Wilder.
- maLength (default: 8) — period of the moving average overlay.
- color (default: 1) — 1 paints the area between the RSI and the 50 line in green/red according to direction; 0 disables the colouring.
- signals (default: 0) — 1 plots small dots at OB/OS crossings; 0 disables them.
Code
//------------------------------------------------------------//
//PRC_Market Structure RSI
//version = 0
//27.05.24
//Iván González @ www.prorealcode.com
//Sharing ProRealTime knowledge
//------------------------------------------------------------//
//-----Inputs-------------------------------------------------//
rsiLength=20
OBlvl=80
OSlvl=20
strCloseType=0
maBool=1
maSelection=1
maLength=8
color=1
signals=0
//------------------------------------------------------------//
//-----Close Type---------------------------------------------//
if strCloseType then
   closeTypeBull=close[1]
   closeTypeBear=close[1]
else
   closeTypeBull=high[1]
   closeTypeBear=low[1]
endif
//-----Get Pivots---------------------------------------------//
pH=high[3]<high[2] and high[2]>high[1]
pL=low[3]>low[2] and low[2]<low[1]

if pH then
   $highprice[z+1]=high[2]
   $highidx[z+1]=barindex[2]
   z=z+1
endif

if pL then
   $lowprice[t+1]=low[2]
   $lowidx[t+1]=barindex[2]
   t=t+1
endif
//------------------------------------------------------------//
//-----Get Source for RSI calculation-------------------------//
$count[0]=0
if isset($highprice[z]) then
   for i=z downto 0 do
      if closeTypeBull>$highprice[i] then
         $highprice[i]=exp(10)
         $count[r+1]=$count[r]+1
         r=r+1
      else
         break
      endif
   next
endif

if isset($lowprice[t]) then
   for j=t downto 0 do
      if closeTypeBear<$lowprice[j] then
         $lowprice[j]=0
         $count[r+1]=$count[r]-1
         r=r+1
      else
         break
      endif
   next
endif
//------------------------------------------------------------//
//-----Get total array count----------------------------------//
total=0
for k=0 to r do
   total=total+$count[r]
next
//------------------------------------------------------------//
//-----RSI total----------------------------------------------//
rsitotal=rsi[rsilength](total)
//------------------------------------------------------------//
//-----RSI Moving Average-------------------------------------//
if maBool then
   rsmMATotal=average[maLength,maSelection](rsitotal)
else
   rsmMATotal=undefined
endif
//------------------------------------------------------------//
//-----Plot configuration-------------------------------------//
if color then
   if rsitotal > 50 then
      rc=0
      gc=255
   else
      rc=255
      gc=0
   endif
   colorbetween(rsitotal,50,rc,gc,0,50)
endif
//------------------------------------------------------------//
//-----Draw Signals-------------------------------------------//
if signals then
   if rsiTotal crosses under OBlvl then
      drawpoint(barindex,OBlvl,2)coloured("red")
   elsif rsiTotal crosses over OSlvl then
      drawpoint(barindex,OSlvl,2)coloured("green")
   endif
endif
//------------------------------------------------------------//
return rsitotal, rsmMATotal coloured("blue")style(line,4), OBlvl as "Overbought Level"style(dottedline2), OSlvl as "Oversold level"style(dottedline2)
