

Market Structure Breakers indicator
Introduction
Market structure analysis could be an essential tool for traders looking to identify critical points in price movements. Breakout points, both bullish and bearish, can provide valuable signals for trading decisions. In this article, we will introduce the Market Structure Breakers indicator, designed to detect and visualize these market structure breakouts on price charts.
The Market Structure Breakers indicator helps traders identify changes in market direction by marking key levels of pivots and breakouts. This allows users to anticipate potential future movements and adjust their strategies accordingly.
Description of the Indicator
The Market Structure Breakers is a technical indicator that identifies and marks breakouts in market structure. This indicator is based on the detection of high and low pivots to determine breakout points, thereby helping traders identify potential trend changes.
Objective of the Indicator
The objective of the Market Structure Breakers is to provide clear signals of breakouts in market structure, both bullish and bearish, by using pivots identified over a specific period. This allows traders to visualize critical points where the market might change direction.
Main Features and General Operation
- Identification of Pivots: The indicator detects high and low pivots based on a user-defined period.
- Detection of Market Structures: Marks bullish and bearish structure breakouts on the chart.
- Visualization of Support and Resistance Events: Draws lines and symbols on the chart to indicate these key events.
The indicator uses a simple yet effective logic to determine pivot points and breakouts, providing a visual tool that facilitates the interpretation of price action.
Components of the Code
Explanation of Variables and Input Parameters
- length: This parameter defines the period used to calculate high and low pivots. By default, it is set to 20.
- $ph and $pl: Arrays that store detected high and low pivots.
- $phx and $plx: Arrays that store the bar indices corresponding to the high and low pivots.
- $lasty and $lastx: Arrays that store the last detected breakouts and their bar indices.
- os: Variable indicating market status (bullish = 1, bearish = -1).
- checkup and checkdw: Control variables to avoid duplication of support and resistance events.
- phcross and plcross: Indicators of high and low pivot crosses.
- breakdown and breakup: Indicators of bullish and bearish breakouts.
Description of Code Sections
Bullish Breaker Section
Calculation of High Pivots:
- Detects points where the current price is lower than the highest price of a defined period, and if that high is higher than the previous and subsequent prices.
Testing for Bullish Market Structure:
- Verifies if the closing price is higher than the last detected high pivot and draws a horizontal line on the chart.
- Labels the bullish market structure breakouts with “MSB” (Market Structure Breaker) and support points with “MSS” (Market Structure Support).
Iterating Through Existing Bullish Structures:
- Checks if the closing price falls below the last support level and draws a red dotted line on the chart to indicate a breakout.
Support Events:
- Draws a black candle to indicate a support event when the price touches but does not break a previous support level.
Bearish Breaker Section
Calculation of Low Pivots:
- Detects points where the current price is higher than the lowest price of a defined period, and if that low is lower than the previous and subsequent prices.
Testing for Bearish Market Structure:
- Verifies if the closing price is lower than the last detected low pivot and draws a horizontal line on the chart.
- Labels the bearish market structure breakouts with “MSB” and resistance points with “MSS”.
Iterating Through Existing Bearish Structures:
- Checks if the closing price rises above the last resistance level and draws a green dotted line on the chart to indicate a breakout.
Resistance Events:
- Draws a black candle to indicate a resistance event when the price touches but does not break a previous resistance level.
Configuration and Use
Adjusting Parameters
The Market Structure Breakers indicator has a main parameter that can be adjusted according to the trader’s needs:
- Length: Defines the period used to calculate high and low pivots. The default value is 20, but it can be adjusted to suit different timeframes and trading styles.
// Example of how to adjust the length parameter

length = 20
Adjusting this parameter allows the trader to calibrate the indicator’s sensitivity to market fluctuations. A lower value will make the indicator more responsive to market movements, while a higher value will make it less sensitive to minor fluctuations.
Interpreting the Results
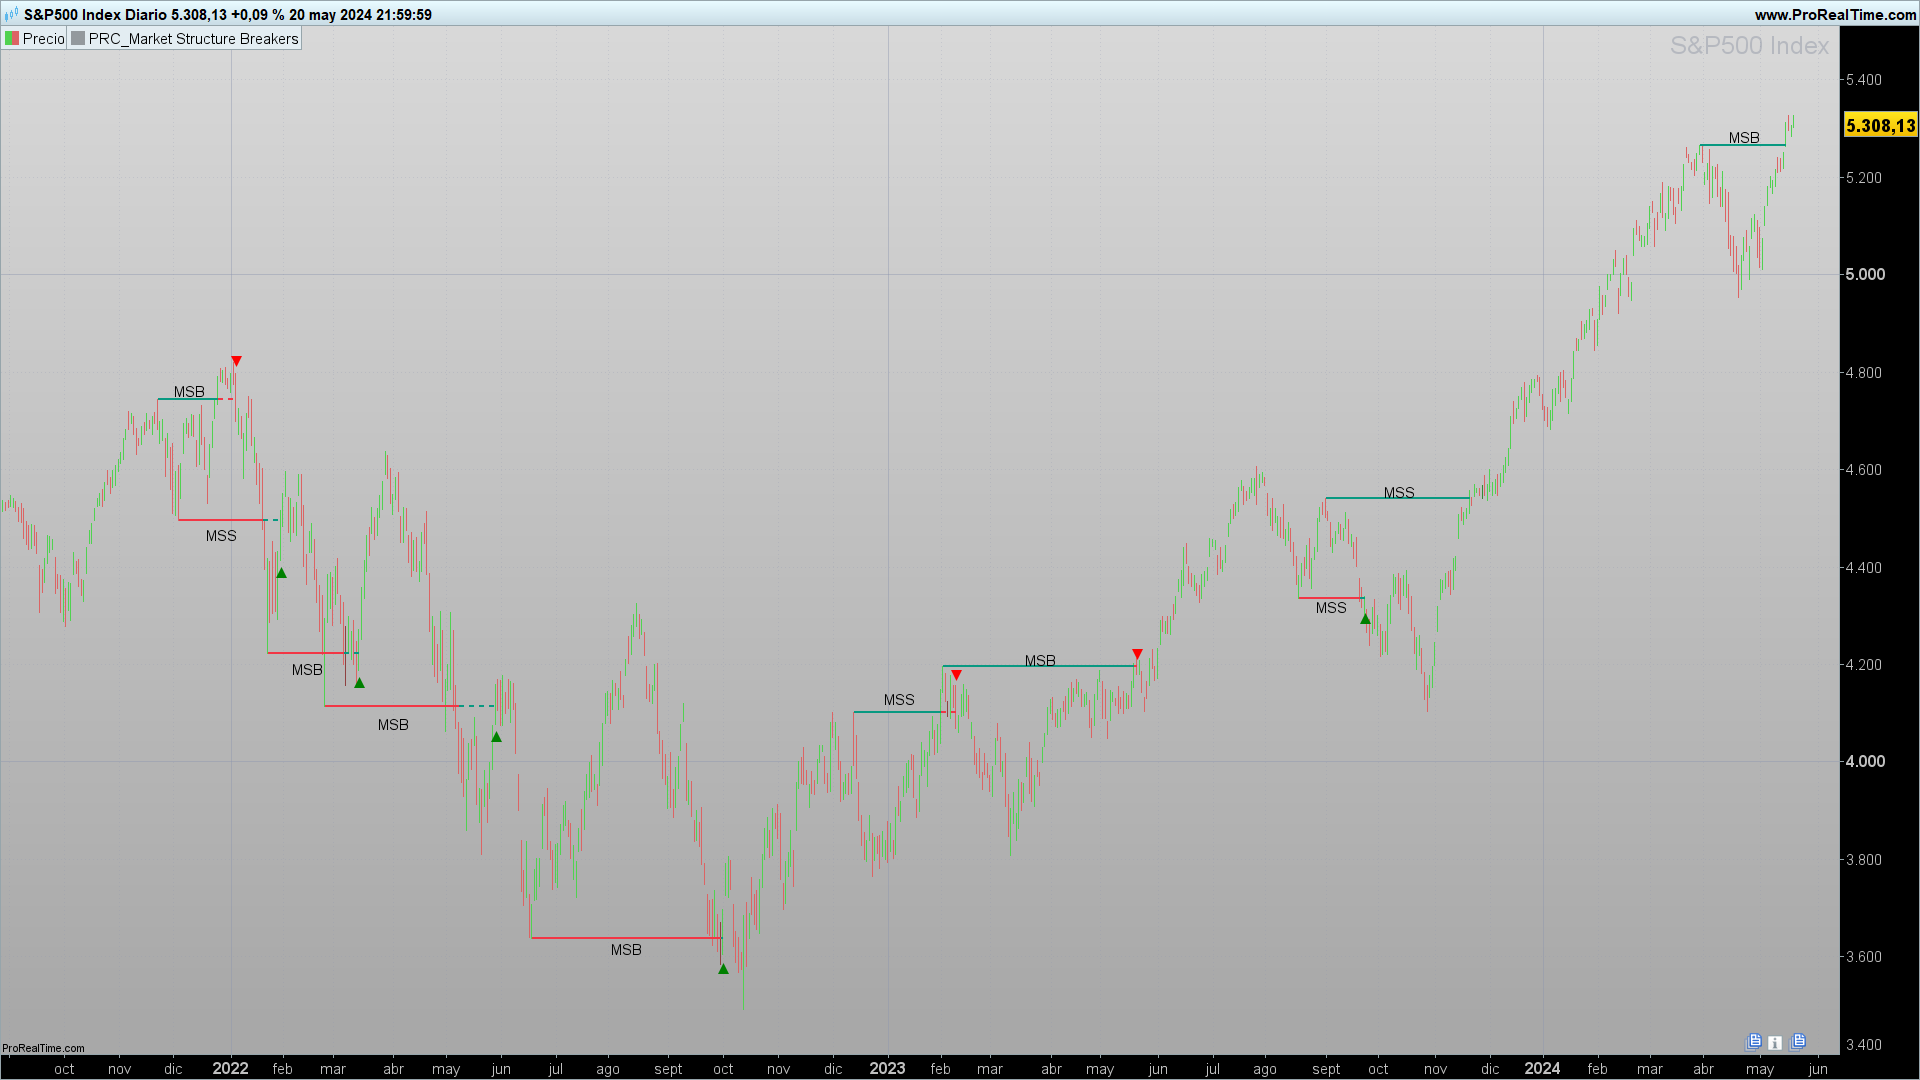
Bullish Breakout Signals
- Green Lines: Indicate a bullish market structure breakout. These lines are drawn when the closing price exceeds the last detected high pivot.
- Label “MSB”: Stands for “Market Structure Breaker” and is placed on the chart to indicate a bullish breakout point.
- Label “MSS”: Stands for “Market Structure Support” and is placed on the chart to indicate a confirmed support point.
Visual Example of Bullish Signals
In the chart, you can see the green lines and the “MSB” and “MSS” labels clearly showing bullish breakouts and support points.
Bearish Breakout Signals
- Red Lines: Indicate a bearish market structure breakout. These lines are drawn when the closing price falls below the last detected low pivot.
- Label “MSB”: Stands for “Market Structure Breaker” and is placed on the chart to indicate a bearish breakout point.
- Label “MSS”: Stands for “Market Structure Support” and is placed on the chart to indicate a confirmed resistance point.
Visual Example of Bearish Signals
In the chart, the red lines and the “MSB” and “MSS” labels clearly indicate bearish breakouts and resistance points.
Advantages and Limitations
Advantages of the Indicator
- Visual Clarity: The Market Structure Breakers provides a clear and visual representation of market structure breakouts, making it easier to identify key points for decision-making.
- Customization: Allows adjusting the length parameter to suit different trading styles and timeframes, enhancing its versatility.
- Identification of Support and Resistance: Helps identify and mark support and resistance events, crucial for planning market entries and exits.
- Applicability in Various Markets: Useful in multiple markets and timeframes, including stocks, forex, futures, and cryptocurrencies.
Limitations of the Indicator
- Signal Lag: Like many technical indicators, it can experience some lag in signals, especially in volatile markets where prices change rapidly.
- Parameter Dependence: The effectiveness of the indicator greatly depends on the length parameter setting. Inappropriate adjustments can lead to false or delayed signals.
- Support and Resistance Events: Sometimes, support and resistance events can be less accurate in extremely volatile markets or with high price fluctuations.
Conclusion
The Market Structure Breakers is a powerful tool for any trader looking for a clear and effective way to identify breakouts in market structure. Its ability to mark key levels and provide visual signals helps traders make informed decisions and better plan their trading strategies.
Despite some limitations, the advantages of using this indicator, such as visual clarity and customization, make it a valuable addition to any trader’s toolkit. Properly adjusting the parameters and understanding its signals can significantly enhance a trader’s ability to identify and act on changes in market direction.
Complete Code
Below is the complete code for the Market Structure Breakers indicator in ProBuilder for ProRealTime:
//PRC_Market Structure Breakers
//version = 0
//15.03.24
//Iván González @ www.prorealcode.com
//Sharing ProRealTime knowledge
//---------------------Inputs------------------------------
lenght = 20
//----------------------------------------------------------//
//----------------Bullish Breaker---------------------------//
//----------------------------------------------------------//
//-----Calculate pivots high------------------------------------------
if high < high[lenght] and highest[lenght](high)<high[lenght] and high[lenght]>highest[lenght](high)[lenght+1] then
$ph[lastset($ph)+1]=high[lenght]
$phx[lastset($phx)+1]=barindex[lenght]
phcross = 0
endif
//-----Test for bullish market structure--------------------
if close > $ph[max(0,lastset($ph))] and not phcross then
drawsegment($phx[max(0,lastset($phx))],$ph[max(0,lastset($ph))],barindex,$ph[max(0,lastset($ph))])style(line,2)coloured(8,153,129)
//MS Label
if os = -1 then
drawtext("MSS",(barindex+$phx[max(0,lastset($phx))])/2,$ph[max(0,lastset($ph))]+0.25*tr)
else
drawtext("MSB",(barindex+$phx[max(0,lastset($phx))])/2,$ph[max(0,lastset($ph))]+0.25*tr)
endif
$lasty2[lastset($lasty2)+1] = $ph[max(0,lastset($ph))]
$lastx2[lastset($lastx2)+1] = barindex
breakdown = 0
checkup = 0
phcross = 1
os = 1
endif
//------Iterate trough existing bullish structures and test for breaks
if close < $lasty2[max(0,lastset($lasty2))] and open > $lasty2[max(0,lastset($lasty2))] and breakdown=0 then
breakdown = 1
checkup = 1
drawsegment($lastx2[max(0,lastset($lastx2))],$lasty2[max(0,lastset($lasty2))],barindex,$lasty2[max(0,lastset($lasty2))])coloured(242, 54, 69)style(dottedline,2)
drawtext("▼",barindex,high+0.25*tr)coloured("red")
endif
//------Check for support events-------------------------------------
lvl2 = $lasty2[max(0,lastset($lasty2))]
if low < lvl2 and min(close,open)> lvl2 and not checkup then
drawcandle(high,high,low,low)coloured("black",90)
checkup=1
endif
//----------------------------------------------------------//
//----------------Bearish Breaker---------------------------//
//----------------------------------------------------------//
//-----Calculate pivots low------------------------------------------
if low > low[lenght] and lowest[lenght](low) > low[lenght] and low[lenght] < lowest[lenght](low)[lenght+1] then
$pl[lastset($pl)+1] = low[lenght]
$plx[lastset($plx)+1] = barindex[lenght]
plcross = 0
endif
//---------------------------------------------------------
//-----Test for bearish market structure--------------------
if close < $pl[max(0,lastset($pl))] and not plcross then
drawsegment($plx[max(0,lastset($plx))],$pl[max(0,lastset($pl))],barindex,$pl[max(0,lastset($pl))])coloured(242, 54, 69)style(line,2)
//MS Label
if os = 1 then
drawtext("MSS",(barindex+$plx[max(0,lastset($plx))])/2,$pl[max(0,lastset($pl))]-0.25*tr)
else
drawtext("MSB",(barindex+$plx[max(0,lastset($plx))])/2,$pl[max(0,lastset($pl))]-0.25*tr)
endif
$lasty[lastset($lasty)+1]=$pl[max(0,lastset($pl))]
$lastx[lastset($lastx)+1]=barindex
plcross=1
os = -1
breakup=0
checkdw=0
endif
//------Iterate trough existing bearish structures and test for breaks
if close > $lasty[max(0,lastset($lasty))] and open < $lasty[max(0,lastset($lasty))] and breakup=0 then
breakup = 1
checkdw = 1
drawsegment($lastx[max(0,lastset($lastx))],$lasty[max(0,lastset($lasty))],barindex,$lasty[max(0,lastset($lasty))])coloured(8,153,129)style(dottedline,2)
drawtext("▲",barindex,low-0.25*tr)coloured("green")
endif
//------Check for resistance events-------------------------------------
lvl = $lasty[max(0,lastset($lasty))]
if high > lvl and max(close,open)<lvl and not checkdw then
drawcandle(high,high,low,low)coloured("black",90)
checkdw=1
endif


return
