

Market Resilience
Here is a “trading strategy” that will find its place in the series of scenarios …
Its design is the result of daily observation over several years transposed in this indicator.
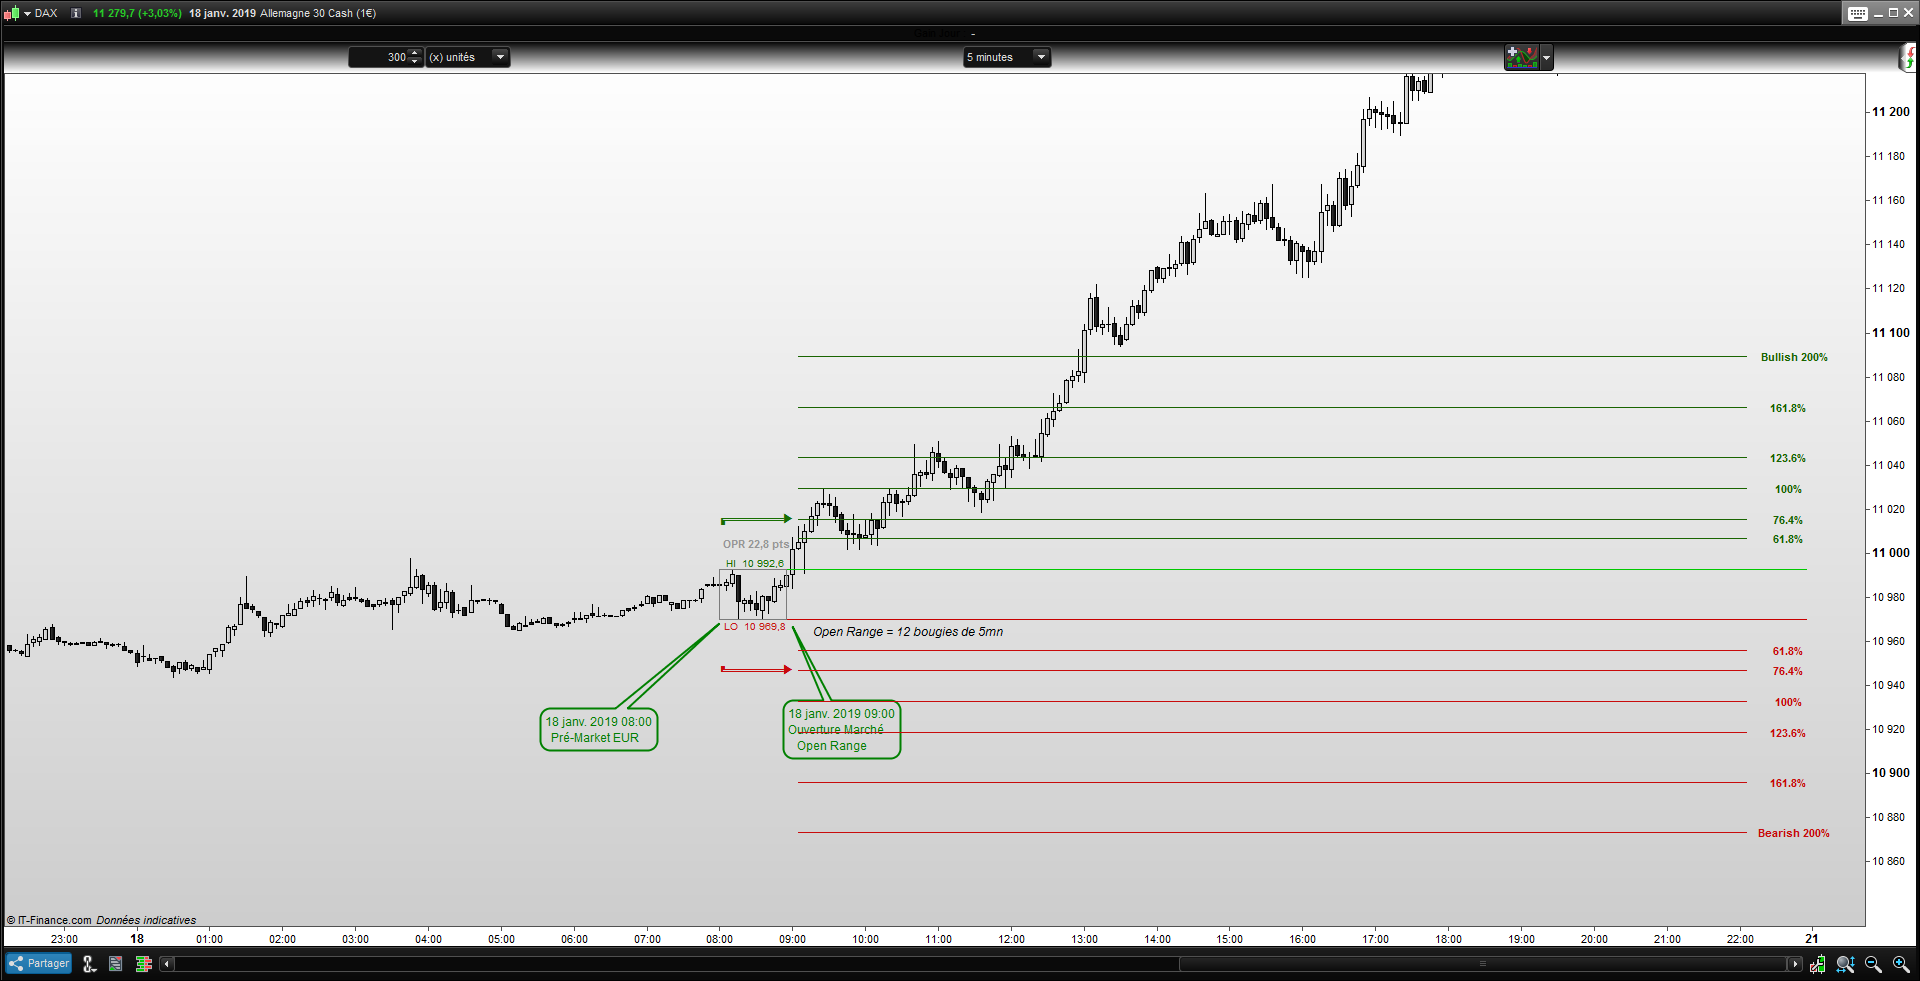
The program generates from the Pre Market data a predictive view of course development by tracing its evolution by the projection of Fibonacci levels!
Initially developed on the index market, this indicator can also be used for currencies or equities by giving similar results.
It allows the development of trading plan by creating a resilient environment on the short-term observation of market movements.
His main interest lies in the way to apprehend a position statement by projecting a layer reflecting the possible evolution of the levels likely to be reached during the active session.
Because the prices have a memory, the market resilience remains an effective decision-making tool by making the short-term trading more serene in part thanks to a clarified vision of the
market, its use is perfect for “Day Trading or Scalping”
All you have to do is define a simple method based on “Pullback, Consolidation, Retracement, Open Range, Level Break, Trend Follow” …
Some will find a practical decision-making tool others a gadget worthy of the era of “shadocks”! It’s for you to see …
Hopefully these few lines of code will benefit you in your trading by being aware that the market is “almost” always right.
- Start of the program on the candle from 08:00 (pre market between 08:00 and 08:59)
- Detection of the level up and down until the closing of the candle of 08h55 “Open Range”
- Calculation of the Fibonacci levels taking as a benchmark the mini point for 0% and the maximum point for 38.2% in the uptrend and its inverse for the downtrend
- Draw the levels thus calculated on the graph with first threshold (target) at 76.4% corresponding to twice the maximum / minimum value (2X OPR) represented by the arrows (green and red)
- Extension of Fibonacci levels up to 200% in both directions …
Available settings:
- “Alpha” Setting transparency of information
- “Offset” Position of the maximum and minimum values above and below the rectangle
- “Level” Visualize or hide the Fibonacci levels
- “Text” Shows or hides the up / down values, arrows (2x OPR) and HI and LO segments
As usual, everything is mixable
// Market Resilence EUR | Graph Indicator
// 19.01.2019 (Release 1.0)
// Swapping @ www.forexswap.fr
// Sharing ProRealTime knowledge (alt+16) ( use with time frame 5mn )

// --- property settings
//Alpha   = 180 // Transparency text
//Offset  = 10  // Offset alphanumeric/rectangle OPR
//Level   = 1   // (0=hidden; 1=observable)
//Text    = 1   // (0=no text; 1=text)
// --- end

DefParam DrawOnLastBarOnly = true

starttime = 080500     // 08h00 Pré Market EU (Cac, Dax, Footsie, ect...)
endtime   = 090000     // 09h00 Ouverture session européenne

alpha = max(alpha,0)   // Restricted input variable Max-Min
alpha = min(alpha,255)

dif = hh-ll
fib38 = hh
fib0  = ll

if time = starttime then
 startbar = barindex
endif
if time = endtime then
 endbar = barindex
endif

if time >= starttime and time <= endtime then
 if high > hh then
  hh = high
 endif
 if low < ll or ll = 0 then
  ll = low
 endif
endif

if intradaybarindex = 0 then
 hh = 0
 ll = 0
endif

//hh = round(hh) // Option résultat valeur arrondi
//ll = round(ll) // Option résultat valeur arrondi

if time > endtime then
 //DrawRectangle(startbar,hh,endbar,ll) coloured(0,255,255,alpha) // Option Rectangle (Alpha = transparence)
 //DrawEllipse(startbar,hh,endbar,ll) coloured(0,255,255,alpha)   // Option ellipse
 DrawSegment(startbar,Hh,endbar,Hh) coloured(123,123,123,alpha)      // Segment Upper
 DrawSegment(startbar,Ll,endbar,Ll) coloured(123,123,123,alpha)      // Segment Lower
 DrawSegment(startbar,hh,endbar-11,ll) coloured(123,123,123,alpha)   // Segment Left
 DrawSegment(startbar+11,Hh,endbar,Ll) coloured(123,123,123,alpha)   // Segment Right
endif

if Text = 1 then
 DrawText("OPR #dif#pts",startbar+6,hh+(offset*4),SansSerif,Bold,11) coloured(150,150,150,alpha)
 DrawText(" HI  #hh# ",startbar+6,hh+(offset),SansSerif,Standard,10) coloured(22,111,0,alpha)
 //DrawText("Bull Market",startbar+5,hh+(offset),Dialog,Bold,12) coloured(22,111,0,alpha) // Option text only
 //DrawLine(barindex-1,hh,barindex,hh) coloured(111,11,111,alpha) // Option ligne continue
 DrawSegment(endbar,hh,barindex,hh) coloured(0,200,0,alpha)
 DrawText("╔═════► ",startbar+6,hh+(dif),Dialog,Bold,10) coloured(22,111,0,alpha) // Option OPR - 100% (Glyphe alt+201, alt+205)
 DrawText(" LO  #ll# ",startbar+6,ll-(offset),SansSerif,Standard,10) coloured(200,20,20,alpha)
 //DrawText("Bear Market",startbar+5,ll-(offset),Dialog,Bold,12) coloured(200,20,20,alpha) // Option text only
 //DrawLine(barindex-1,ll,barindex,ll) coloured(111,11,111,alpha) // Option ligne continue
 DrawSegment(endbar,ll,barindex,ll) coloured(200,0,0,alpha)
 DrawText("╚═════► ",startbar+6,ll-(dif),Dialog,Bold,10) coloured(200,10,10,alpha) // Option OPR - 100% (Glyphe alt+200, alt+205)
endif

if Level = 1 then
 fibobull200 = (fib38-fib0)*5.236+fib0
 DrawSegment(endbar+2,fibobull200,barindex-10,fibobull200) coloured(25,100,0,alpha)
 DrawText("Bullish 200%",barindex-2,fibobull200,SansSerif,Bold,11) coloured(25,100,0,alpha)
 fibobull162 = (fib38-fib0)*4.236+fib0
 DrawSegment(endbar+2,fibobull162,barindex-10,fibobull162) coloured(25,100,0,alpha)
 DrawText("161.8%",barindex-3,fibobull162,SansSerif,Bold,11) coloured(25,100,0,alpha)
 fibobull124 = (fib38-fib0)*3.236+fib0
 DrawSegment(endbar+2,fibobull124,barindex-10,fibobull124) coloured(25,100,0,alpha)
 DrawText("123.6%",barindex-3,fibobull124,SansSerif,Bold,11) coloured(25,100,0,alpha)
 fibobull100 = (fib38-fib0)*1.618+fib38
 DrawSegment(endbar+2,fibobull100,barindex-10,fibobull100) coloured(25,100,0,alpha)
 DrawText("100%",barindex-3,fibobull100,SansSerif,Bold,11) coloured(25,100,0,alpha)
 fibobull76 = (fib38-fib0)+fib38
 DrawSegment(endbar+2,fibobull76,barindex-10,fibobull76) coloured(25,100,0,alpha)
 DrawText("76.4%",barindex-3,fibobull76,SansSerif,Bold,11) coloured(25,100,0,alpha)
 fibobull62 = (fib38-fib0)*1.618+fib0
 DrawSegment(endbar+2,fibobull62,barindex-10,fibobull62) coloured(25,100,0,alpha)
 DrawText("61.8%",barindex-3,fibobull62,SansSerif,Bold,11) coloured(25,100,0,alpha)

 fibobear62 = (fib0-fib38)*.618+fib0
 DrawSegment(endbar+2,fibobear62,barindex-10,fibobear62) coloured(200,11,11,alpha)
 DrawText("61.8%",barindex-3,fibobear62,SansSerif,Bold,11) coloured(200,10,10,alpha)
 fibobear76 = (fib0-fib38)+fib0
 DrawText("76.4%",barindex-3,fibobear76,SansSerif,Bold,11) coloured(200,10,10,alpha)
 DrawSegment(endbar+2,fibobear76,barindex-10,fibobear76) coloured(200,11,11,alpha)
 fibobear100 = (fib0-fib38)*1.618+fib0
 DrawText("100%",barindex-3,fibobear100,SansSerif,Bold,11) coloured(200,10,10,alpha)
 DrawSegment(endbar+2,fibobear100,barindex-10,fibobear100) coloured(200,11,11,alpha)
 fibobear124 = (fib0-fib38)*2.236+fib0
 DrawSegment(endbar+2,fibobear124,barindex-10,fibobear124) coloured(200,11,11,alpha)
 DrawText("123.6%",barindex-3,fibobear124,SansSerif,Bold,11) coloured(200,10,10,alpha)
 fibobear162 = (fib0-fib38)*3.236+fib0
 DrawSegment(endbar+2,fibobear162,barindex-10,fibobear162) coloured(200,11,11,alpha)
 DrawText("161.8%",barindex-3,fibobear162,SansSerif,Bold,11) coloured(200,10,10,alpha)
 fibobear200 = (fib0-fib38)*4.236+fib0
 DrawSegment(endbar+2,fibobear200,barindex-10,fibobear200) coloured(200,11,11,alpha)
 DrawText("Bearish 200%",barindex-2,fibobear200,SansSerif,Bold,11) coloured(200,10,10,alpha)
endif

return