

Market Cap Indicator
August 6, 2018, 7:20 AM
Indicators
0 Comments
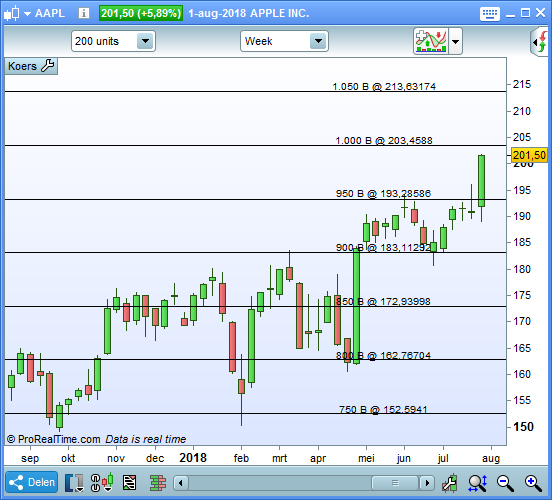
Put in the number of outstanding shares in millions and the code draws horizontal lines on specific market cap levels. Code is adjusting for the size of the company.
//Drawing of horizontal Lines on Market Cap Levels
//Put outstanding shares in Millions (e.g. Aapl 4915138000 = 4915.138)
SharesOutstandingMillions = 4915.138

DefParam DrawOnLastBarOnly = true

MarketCap = SharesOutstandingMillions * close

if MarketCap > 250000 THEN //Bigger then 250B, steps of 50B
 Step = 50
 DrawDistance = 0.005
elsif MarketCap < 250000 and MarketCap > 100000 THEN //Between 100B and 250B, steps of 10B
 Step = 10
 DrawDistance = 0.005
elsif MarketCap < 100000 and MarketCap > 25000 THEN //Between 25B and 100B, steps of 5B
 Step = 5
 DrawDistance = 0.007
elsif MarketCap < 25000 and MarketCap > 10000 THEN //Between 10B and 25B, steps of 1B
 Step = 1
 DrawDistance = 0.01
else // lower then 10B, steps of 0.5B
 Step = 0.5
 DrawDistance = 0.01
endif

//Number of lines to be drawn
for i=0 to 25 do
 MarketCapLevel = Step * i
 PriceLevel = (MarketCapLevel * 1000)/SharesOutstandingMillions
 DRAWHLINE(PriceLevel)
 DRAWTEXT("#MarketCapLevel#B @ #PriceLevel#", barindex-10, PriceLevel+(DrawDistance*PriceLevel), dialog) COLOURED (0,0,0)
next

return
Download
Filename:
MarketCapIndicator.itf
Downloads:
96
Average
This author is like an anonymous function, present but not directly identifiable. More details on this code architect as soon as they exit 'incognito' mode.
Author’s Profile
Loading...