Machine Learning Z-Score
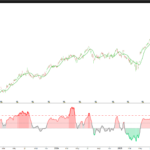
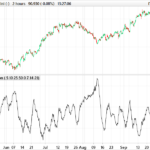
The Machine Learning Z-Score indicator by Steversteves is a popular TV publication that combines automatic lookback selection (advertised as “Machine Learning”) with a z-score-based mean-reversion signal. A faithful ProBuilder port was requested in this forum thread.
After translating it line by line and testing it on several markets and timeframes, the results were uninspiring. This article is the rest of the process: a step-by-step audit of the original logic, the structural defects we identified, the corrections we applied, and the honest backtest of the corrected version. The final takeaway is more useful than any indicator: not every script that says “Machine Learning” deserves the label, and what looks sophisticated may be hiding very simple flaws.
What the Original Does
The original is two pieces stacked together:
- Automatic lookback selection. The script computes the correlation between price and bar index over ten windows (50, 100, 150, …, 500 bars). It picks the window with the highest R² (or absolute Pearson coefficient, both branches exist in the code) and uses that length to compute the z-score. The marketing label for this step is “Machine Learning”.
- Z-score mean-reversion. With the chosen lookback len:
- meanPrice = Average[len](close)
- stdPrice = Std[len](close)
- z = (close – meanPrice) / stdPrice
The signal logic in v1 is: BUY when z stays at the lowest value of the last len bars for more than 8 consecutive bars; SELL when symmetric. A take-profit is plotted at a “dynamic” level that, on closer inspection, equals the local mean.
Six Structural Defects of the Original
We found six issues in v1. Listed in order of impact:
1. The “Machine Learning” step picks the wrong window
Mean-reversion strategies make statistical sense in range-bound regimes, not in trending markets. The intuition is straightforward: when price is trending cleanly in one direction, a low z-score is the start of a continuation move, not the start of a reversion to the mean. The mean only matters when the mean is itself stable, which happens precisely when R² is low (no clear linear trend, sideways behaviour).
The original picks the window with maximum R², doing the opposite of what mean-reversion needs. It auto-selects the lookback in which price has the cleanest trend, then trades reversions against that trend. The two halves contradict each other by design.
The fix is to invert the criterion: pick the window with the minimum R² (the most range-bound).
2. The buy trigger is auto-satisfied
The BUY condition in v1 is:
IF c <= lowz THEN
   buywait = buywait + 1
   ...
ENDIF
with lowz = Lowest[len](c). But c (the current z-score) is itself part of the window that Lowest[len] looks back over. Whenever c makes a new len-bar low, by definition c = lowz. The condition fires automatically on every new minimum, with no filter on signal quality at all. It is not detecting anything, it is definitionally true whenever price extends its extreme.
A robust trigger is a cross back from the extreme:
buyCross = (z[1] <= -zthreshold) AND (z > -zthreshold)
This fires when the z-score has been in deep negative territory and now crosses back up. It signals a reversion already in progress, not a continuation of the fall.
3. The “wait” counter has a reset bug
The original code is:
IF c <= lowz THEN
   buywait = buywait + 1
   IF buywait > 8 THEN
      // emit signal
      buywait = 0
   ENDIF
ENDIF
There is no ELSE buywait = 0. The counter only resets when a signal fires, never when the condition fails. As a result, 5 bars of c <= lowz accumulated today, 4 bars from two months ago, and 1 bar from last year can sum to 10 and emit a “8 consecutive bars” signal that is anything but consecutive. The corrected version does not need the counter at all (the cross trigger above replaces it).
4. Z-score on raw price is biased by the trend
Computing z = (close – mean) / std on a trending price series produces a misleading z-score. As price trends up, the rolling mean trails behind; the residual (close – mean) stays positive for long stretches, and the standard deviation is dominated by the trend itself. The “extreme” reading is not extreme relative to the noise; it is just the trend.
A cleaner approach is to z-score the residuals of a linear regression rather than raw close:
trendline = LinearRegression[len](close)
src = close - trendline
meanSrc = Average[len](src)
stdSrc  = Std[len](src)
z = (src - meanSrc) / stdSrc
By construction the residuals have near-zero mean and a standard deviation that measures dispersion orthogonal to the trend. The z-score now measures how far price is from its own trend, not how far it is from a lagging average. We expose this as an optional input (useDetrend) so both modes can be compared.
5. No regime filter
Mean-reversion longs in the middle of a clean downtrend keep catching falling knives. The original has no regime filter, so every extreme z-score fires regardless of context. We add an optional one (regimeFilter) with two modes:
- MA slope: longs only when the moving average is rising (ma > ma[slopeBars]), shorts only when falling. Note we deliberately do not use close > MA here; that condition collides with the very setup the z-score is detecting (price stretched below mean), so as soon as malen is reduced the filter blocks almost everything. The slope test sidesteps that problem.
- ADX low: signals only when ADX is below a configurable threshold (operate only in non-trending markets).
6. The “smoothed z-score” used as TP is mathematically noise
The original computes:
sma = Average[len](c)
z0  = a + sma * b   // "dynamic take-profit"
But Average[len] of the z-score c, where c itself is (price – mean) / std and the inner mean is computed over the same len, is approximately zero by construction. The “smoothed z-score” is dominated by noise around zero. Multiplying it by b and adding it to a produces a target level that is essentially a plus a small random offset. There is no statistical content in this construction.
The replacement is simple. The take-profit reference is the local mean directly:
IF useDetrend = 1 THEN
   tpRef = LinearRegression[len](close) + meanSrc
ELSE
   tpRef = meanSrc
ENDIF
This guarantees tpRef is always in price units and represents the actual expected reversion target.
Additional Practical Layers
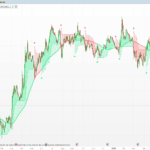
Beyond fixing the six defects above, the v2 adds practical layers that make the indicator usable as a study tool:
- Fixed stop loss at slMult × ATR from entry (configurable; predictable risk per trade).
- Risk/reward filter: signals are dropped at source if (tpRef – entry) / (entry – stop) < minRR. The default minRR = 1 guarantees every emitted signal has at least 1R reward potential.
- Cooldown: minimum cooldownBars between two signals on the same side. Prevents clusters of 2-3 entries in adjacent bars when the z-score oscillates near the threshold.
- Inline trade tracking: the indicator detects, bar by bar, whether each emitted trade closes at TP or SL. Counters accumulate trades, wins, losses, sum of R, broken down by long/short. The result is rendered in a small statistics panel anchored to the top-right corner of the chart via ANCHOR(TOPRIGHT, XSHIFT, YSHIFT). Conservative tie-break: if both TP and SL are touched on the same bar, the SL wins.
How to Read the Stats Box
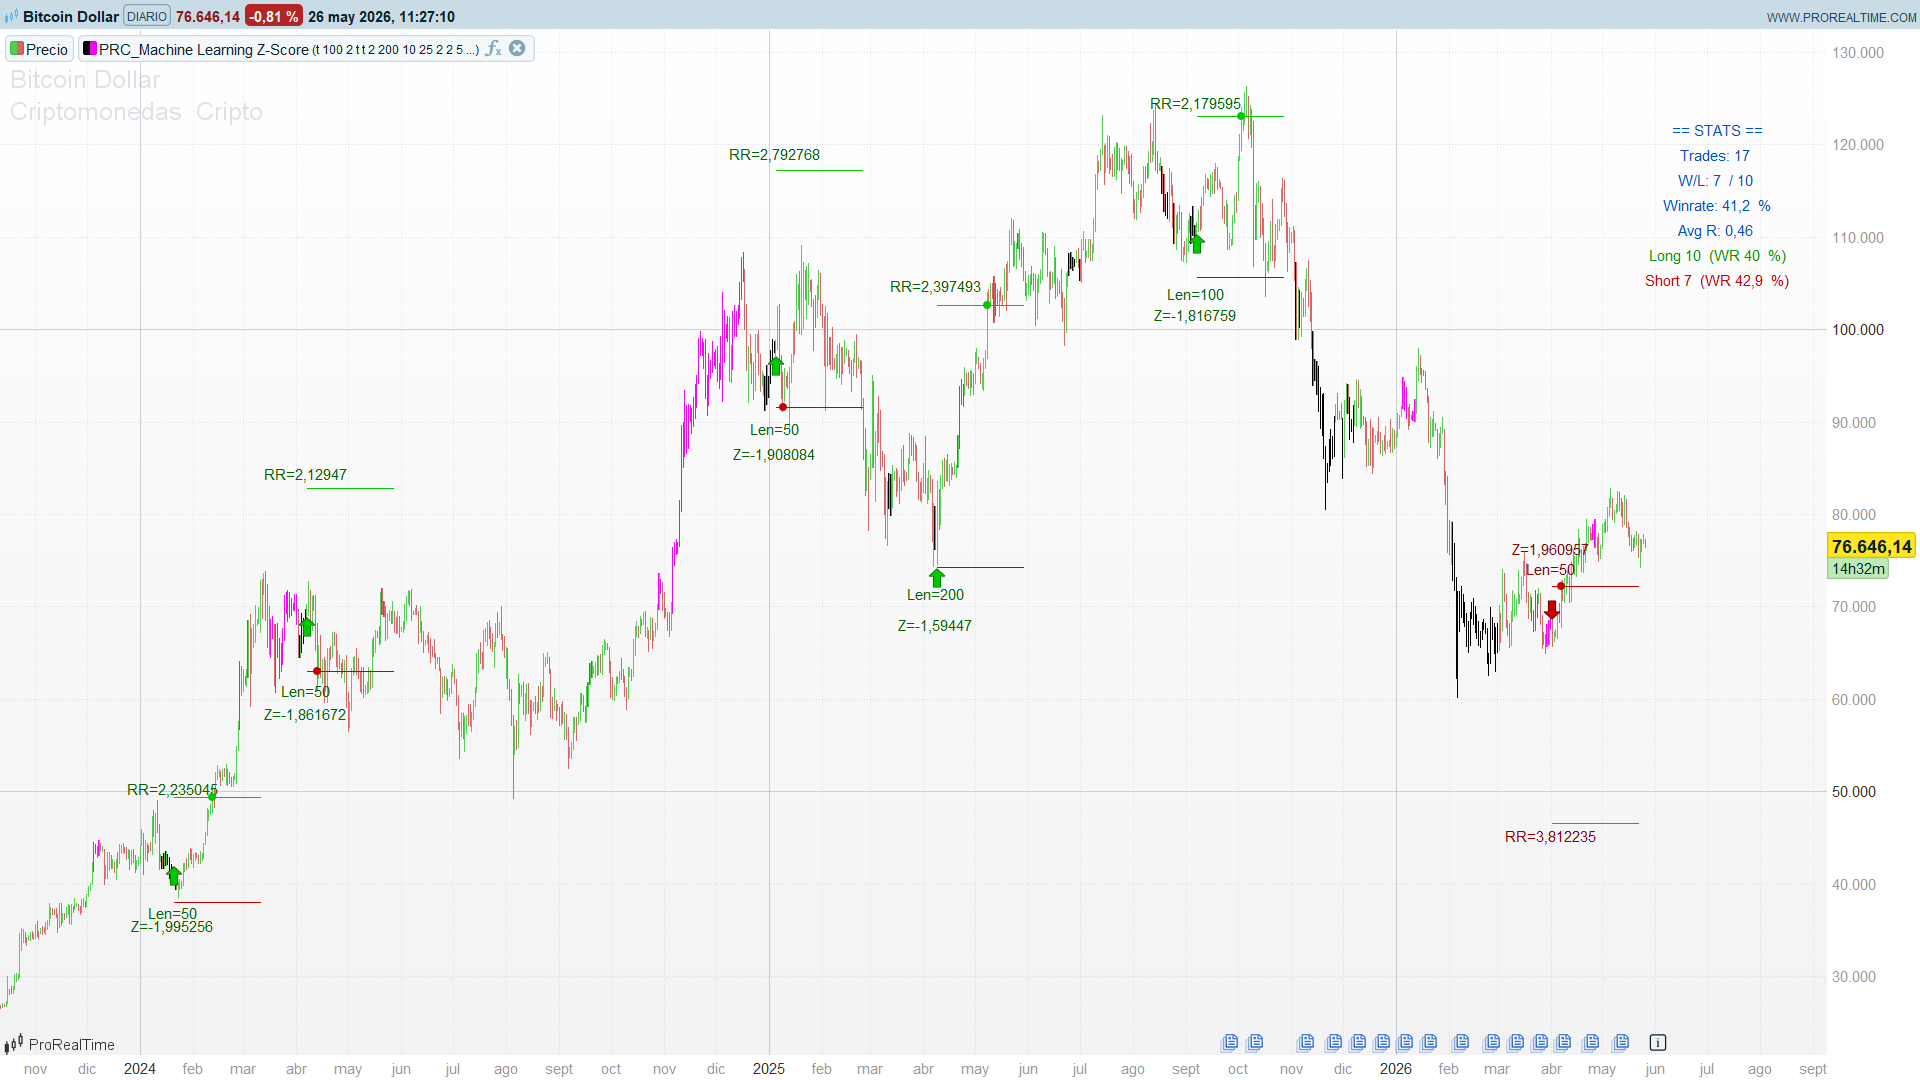
When the indicator is loaded, a fixed panel appears in the top-right corner:
== STATS ==
Trades: 49
W/L: 22 / 27
Winrate: 44.9 %
Avg R: 0.57
Long 36 (WR 47.2 %)
Short 13 (WR 38.5 %)
Interpretation:
- Avg R > 0 means positive expectancy (every average trade gains R-units). Below zero, the system is not operable as-is.
- Winrate around 45% with Avg R near 0.5 is the typical signature of a reasonable mean-reversion system with minRR = 1 and the actual TP often farther than 1R from entry.
- Long WR ≠ Short WR flags directional asymmetry that may be exploitable via the regime filter.
The Code
//-------------------------------------------------------------
// PRC_Machine Learning Z-Score v2.4
// version = 2.4
// Mejorado por Ivan Gonzalez @ www.prorealcode.com
// Basado en la idea original de Steversteves (v1 publicada 10.09.25)
//Sharing ProRealTime knowledge
//-------------------------------------------------------------
// ===== Inputs =====
//-------------------------------------------------------------
autoadjust = 1       // 1 = pick lookback with min R2, 0 = use lengthinput
lengthinput = 100    // Fixed lookback when autoadjust = 0
zthreshold = 2.0     // Extreme z-score threshold (+/-2 sigma)
useDetrend = 0       // 1 = z-score on LinReg residuals, 0 = raw price
regimeFilter = 0     // 1 = apply regime filter, 0 = no filter
regimeMode = 1       // 1 = MA slope, 2 = ADX low
malen = 200          // MA length for regime filter
slopeBars = 10       // Bars back for MA slope test
adxLimit = 25        // ADX threshold (regimeMode = 2)
slMult = 2.0         // Stop loss = slMult * ATR from entry
minRR = 1.0          // Minimum reward/risk ratio to emit signal
cooldownBars = 5     // Minimum bars between signals on the same side
plottgt = 1          // Draw TP / SL segments at each signal
showTradeClose = 1   // Draw a point where TP or SL is hit
showStats = 1        // Show stats panel in top-right corner
barcolor = 1         // Colour candles in extreme zones
//-------------------------------------------------------------
// ===== Seleccion automatica de lookback (R2 minimo) =====
//-------------------------------------------------------------
cor1  = R2[50](close)
cor2  = R2[100](close)
cor3  = R2[150](close)
cor4  = R2[200](close)
cor5  = R2[250](close)
cor6  = R2[300](close)
cor7  = R2[350](close)
cor8  = R2[400](close)
cor9  = R2[450](close)
cor10 = R2[500](close)

mincor = MIN(MIN(MIN(MIN(MIN(cor1,cor2),cor3),MIN(cor4,cor5)),MIN(cor6,cor7)),MIN(MIN(cor8,cor9),cor10))

IF autoadjust = 1 THEN
   IF mincor = cor1 THEN
      len = 50
   ELSIF mincor = cor2 THEN
      len = 100
   ELSIF mincor = cor3 THEN
      len = 150
   ELSIF mincor = cor4 THEN
      len = 200
   ELSIF mincor = cor5 THEN
      len = 250
   ELSIF mincor = cor6 THEN
      len = 300
   ELSIF mincor = cor7 THEN
      len = 350
   ELSIF mincor = cor8 THEN
      len = 400
   ELSIF mincor = cor9 THEN
      len = 450
   ELSE
      len = 500
   ENDIF
ELSE
   len = lengthinput
ENDIF
//-------------------------------------------------------------
// ===== Detrending opcional =====
//-------------------------------------------------------------
IF useDetrend = 1 THEN
   trendline = LinearRegression[len](close)
   src = close - trendline
ELSE
   src = close
ENDIF
//-------------------------------------------------------------
// ===== Z-Score =====
//-------------------------------------------------------------
meanSrc = Average[len](src)
stdSrc  = Std[len](src)

IF stdSrc > 0 THEN
   z = (src - meanSrc) / stdSrc
ELSE
   z = 0
ENDIF
//-------------------------------------------------------------
// ===== Filtro de regimen =====
//-------------------------------------------------------------
allowLong  = 1
allowShort = 1

IF regimeFilter = 1 THEN
   IF regimeMode = 1 THEN
      ma = Average[malen](close)
      IF ma > ma[slopeBars] THEN
         allowLong  = 1
         allowShort = 0
      ELSIF ma < ma[slopeBars] THEN
         allowLong  = 0
         allowShort = 1
      ELSE
         allowLong  = 1
         allowShort = 1
      ENDIF
   ELSE
      adxV = ADX[14]
      IF adxV < adxLimit THEN
         allowLong  = 1
         allowShort = 1
      ELSE
         allowLong  = 0
         allowShort = 0
      ENDIF
   ENDIF
ENDIF
//-------------------------------------------------------------
// ===== Niveles TP y SL =====
//-------------------------------------------------------------
atr = AverageTrueRange[14](close)

slLong  = close - slMult * atr
slShort = close + slMult * atr

IF useDetrend = 1 THEN
   tpRef = LinearRegression[len](close) + meanSrc
ELSE
   tpRef = meanSrc
ENDIF
//-------------------------------------------------------------
// ===== Ratios RR =====
//-------------------------------------------------------------
riskLong  = close - slLong
riskShort = slShort - close

IF riskLong > 0 THEN
   rrLong = (tpRef - close) / riskLong
ELSE
   rrLong = 0
ENDIF

IF riskShort > 0 THEN
   rrShort = (close - tpRef) / riskShort
ELSE
   rrShort = 0
ENDIF
//-------------------------------------------------------------
// ===== Cooldown =====
//-------------------------------------------------------------
ONCE barssincebuy  = 1000
ONCE barssincesell = 1000

barssincebuy  = barssincebuy + 1
barssincesell = barssincesell + 1
//-------------------------------------------------------------
// ===== Estado de tracking (persistente) =====
//-------------------------------------------------------------
ONCE inLong = 0
ONCE inShort = 0
ONCE entryLong = 0
ONCE entryShort = 0
ONCE tpLevelLong = 0
ONCE tpLevelShort = 0
ONCE slLevelLong = 0
ONCE slLevelShort = 0

ONCE longsCount  = 0
ONCE longsWins   = 0
ONCE shortsCount = 0
ONCE shortsWins  = 0
ONCE rSum        = 0
//-------------------------------------------------------------
// ===== Gestion de LONG abierto: detectar TP o SL =====
//-------------------------------------------------------------
IF inLong = 1 THEN
   // Convencion conservadora: si la vela toca SL y TP, gana el SL
   IF low <= slLevelLong THEN
      longsCount = longsCount + 1
      rSum = rSum - 1
      IF showTradeClose = 1 THEN
         DRAWPOINT(barindex, slLevelLong, 2) COLOURED(200,0,0)
      ENDIF
      inLong = 0
   ELSIF high >= tpLevelLong THEN
      longsCount = longsCount + 1
      longsWins = longsWins + 1
      rWin = (tpLevelLong - entryLong) / (entryLong - slLevelLong)
      rSum = rSum + rWin
      IF showTradeClose = 1 THEN
         DRAWPOINT(barindex, tpLevelLong, 2) COLOURED(0,200,0)
      ENDIF
      inLong = 0
   ENDIF
ENDIF
//-------------------------------------------------------------
// ===== Gestion de SHORT abierto: detectar TP o SL =====
//-------------------------------------------------------------
IF inShort = 1 THEN
   IF high >= slLevelShort THEN
      shortsCount = shortsCount + 1
      rSum = rSum - 1
      IF showTradeClose = 1 THEN
         DRAWPOINT(barindex, slLevelShort, 2) COLOURED(200,0,0)
      ENDIF
      inShort = 0
   ELSIF low <= tpLevelShort THEN
      shortsCount = shortsCount + 1
      shortsWins = shortsWins + 1
      rWin = (entryShort - tpLevelShort) / (slLevelShort - entryShort)
      rSum = rSum + rWin
      IF showTradeClose = 1 THEN
         DRAWPOINT(barindex, tpLevelShort, 2) COLOURED(0,200,0)
      ENDIF
      inShort = 0
   ENDIF
ENDIF
//-------------------------------------------------------------
// ===== Senales y apertura de trades =====
//-------------------------------------------------------------
buyCross  = (z[1] <= -zthreshold) AND (z > -zthreshold)
sellCross = (z[1] >=  zthreshold) AND (z <  zthreshold)

// LONG nueva
IF inLong = 0 AND buyCross AND allowLong = 1 AND z < 0 AND rrLong >= minRR AND barssincebuy >= cooldownBars THEN
   inLong = 1
   entryLong = close
   tpLevelLong = tpRef
   slLevelLong = slLong
   barssincebuy = 0

   DRAWARROWUP(barindex, low - 0.35*atr) COLOURED(0,200,0)
   DRAWTEXT("Z=#z#",       barindex, slLong - 1.5*atr) COLOURED("darkgreen")
   DRAWTEXT("Len=#len#",   barindex, slLong - 0.7*atr) COLOURED("darkgreen")
   DRAWTEXT("RR=#rrLong#", barindex, tpRef + 0.5*atr)  COLOURED("darkgreen")
   IF plottgt = 1 THEN
      DRAWSEGMENT(barindex, tpRef,  barindex+50, tpRef)  COLOURED(0,200,0)
      DRAWSEGMENT(barindex, slLong, barindex+50, slLong) COLOURED(200,0,0)
   ENDIF
ENDIF

// SHORT nueva
IF inShort = 0 AND sellCross AND allowShort = 1 AND z > 0 AND rrShort >= minRR AND barssincesell >= cooldownBars THEN
   inShort = 1
   entryShort = close
   tpLevelShort = tpRef
   slLevelShort = slShort
   barssincesell = 0

   DRAWARROWDOWN(barindex, high + 0.35*atr) COLOURED(200,0,0)
   DRAWTEXT("Z=#z#",        barindex, slShort + 1.5*atr) COLOURED("darkred")
   DRAWTEXT("Len=#len#",    barindex, slShort + 0.7*atr) COLOURED("darkred")
   DRAWTEXT("RR=#rrShort#", barindex, tpRef - 0.5*atr)   COLOURED("darkred")
   IF plottgt = 1 THEN
      DRAWSEGMENT(barindex, tpRef,   barindex+50, tpRef)   COLOURED(0,200,0)
      DRAWSEGMENT(barindex, slShort, barindex+50, slShort) COLOURED(200,0,0)
   ENDIF
ENDIF
//-------------------------------------------------------------
// ===== Coloreado de velas en extremos =====
//-------------------------------------------------------------
IF barcolor = 1 THEN
   IF z >= zthreshold THEN
      DRAWCANDLE(open, high, low, close) COLOURED("fuchsia")
   ELSIF z <= -zthreshold THEN
      DRAWCANDLE(open, high, low, close) COLOURED("black")
   ENDIF
ENDIF
//-------------------------------------------------------------
// ===== Cuadro de stats en la ultima barra =====
//-------------------------------------------------------------
IF showStats = 1 AND IsLastBarUpdate THEN
   totalTrades = longsCount + shortsCount
   totalWins   = longsWins + shortsWins
   totalLosses = totalTrades - totalWins

   IF totalTrades > 0 THEN
      winrate = ROUND(1000 * totalWins / totalTrades) / 10
      avgR    = ROUND(100 * rSum / totalTrades) / 100
   ELSE
      winrate = 0
      avgR    = 0
   ENDIF

   IF longsCount > 0 THEN
      wrLong = ROUND(1000 * longsWins / longsCount) / 10
   ELSE
      wrLong = 0
   ENDIF

   IF shortsCount > 0 THEN
      wrShort = ROUND(1000 * shortsWins / shortsCount) / 10
   ELSE
      wrShort = 0
   ENDIF

   // Panel anclado a la esquina superior derecha (no se mueve con scroll/zoom)
   panelX = -200   // 200 px a la izquierda del borde derecho
   topY   = -100   // 100 px hacia abajo del borde superior

   DRAWTEXT("== STATS ==",                          panelX, topY)        COLOURED(0,80,200)  ANCHOR(TOPRIGHT, XSHIFT, YSHIFT)
   DRAWTEXT("Trades: #totalTrades#",                panelX, topY - 25)   COLOURED(0,80,200)  ANCHOR(TOPRIGHT, XSHIFT, YSHIFT)
   DRAWTEXT("W/L: #totalWins# / #totalLosses#",     panelX, topY - 50)   COLOURED(0,80,200)  ANCHOR(TOPRIGHT, XSHIFT, YSHIFT)
   DRAWTEXT("Winrate: #winrate# %",                 panelX, topY - 75)   COLOURED(0,80,200)  ANCHOR(TOPRIGHT, XSHIFT, YSHIFT)
   DRAWTEXT("Avg R: #avgR#",                        panelX, topY - 100)  COLOURED(0,80,200)  ANCHOR(TOPRIGHT, XSHIFT, YSHIFT)
   DRAWTEXT("Long #longsCount# (WR #wrLong# %)",    panelX, topY - 125)  COLOURED(0,150,0)   ANCHOR(TOPRIGHT, XSHIFT, YSHIFT)
   DRAWTEXT("Short #shortsCount# (WR #wrShort# %)", panelX, topY - 150)  COLOURED(200,0,0)   ANCHOR(TOPRIGHT, XSHIFT, YSHIFT)
ENDIF
//-------------------------------------------------------------
RETURN
Honest Results
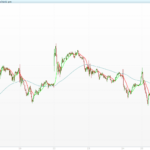
The corrected v2 was tested on a few instruments and timeframes.
The expectancy is mildly positive on some markets, but the indicator is not robust across instruments and timeframes. It is more useful as a study tool than as a stand-alone signal generator. Adding extra filters (volatility regimes, time-of-day, support/resistance proximity, etc.) would likely push results into overfit territory without a real out-of-sample validation. We deliberately stop here.
The Real Lesson
When an indicator’s title contains “Machine Learning”, “AI”, “Neural Network” or similar buzzwords, read the source carefully. In the case of this Z-Score:
- The “Machine Learning” step turned out to be a fixed table of ten candidate lookbacks and an argmax. There is no learning, no optimization loop, no out-of-sample evaluation. The label is marketing.
- Even if we accept the framing as auto-selection, the criterion (maximum R²) is the opposite of what mean-reversion needs. The two halves of the indicator work against each other.
- The signal logic has a self-fulfilling condition (c <= Lowest[len](c)) and a counter bug (buywait is never reset on the failing branch). Either of these would have been caught by anyone tracing the indicator with print statements.
The mistake is not Steversteves’s alone. Indicator marketplaces reward complex-looking ideas, not validated ones. The defense is always the same: understand every line of code in any indicator you intend to use, demand a proper backtest with realistic costs, and treat brand-name labels (“AI”, “ML”, “smart”) as a marketing input, not a quality signal. This article is a small contribution to that habit.