

MACD Z-Score standardized value
March 16, 2016, 3:24 PM
Indicators
1 Comment
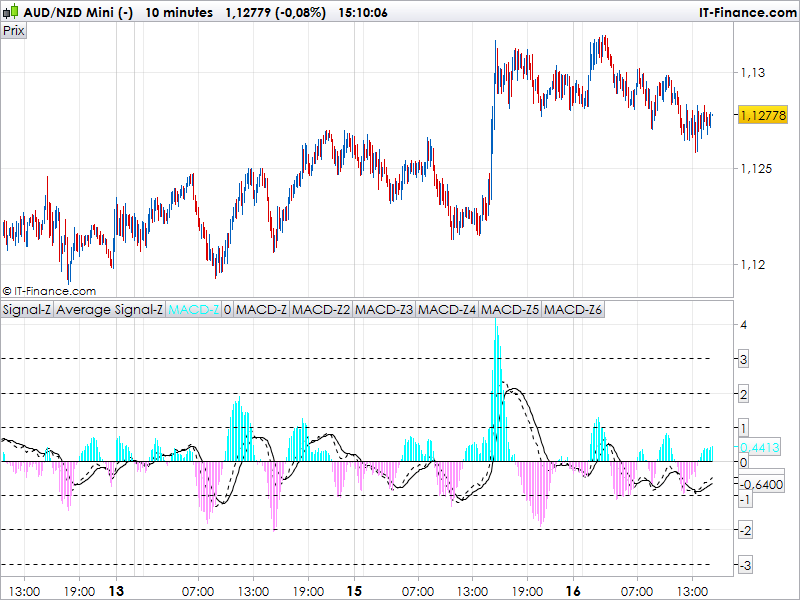
This indicator is a standardized MACD, it gives values also knows as Z-Score which represent the deviation of a value compared to an average of its deviation over a greater period.
By default the study period is set to 2000. So the indicator will draw the current MACD normalized accordingly to what happen to the MACD in this past 2000 bars. The Z-Score is drawn from -3 to +3 deviation from the 0 mean. So adapt these lines to the period and volatility of the instrument you are studying.
This code could be adapted to any other indicator.
FastLength = 12
SlowLength = 26
MACDLength = 9

SamplePeriod = 2000

// MACD
ValueSample = ExponentialAverage[FastLength](close) - ExponentialAverage[SlowLength](close)
AvgSample = ExponentialAverage[MACDLength](ValueSample)
DiffSample = ValueSample - AvgSample

//These are the Sample Mean and Sample Standard Deviations of
//the 3 output values of the MACD function
SMValue = Average[SamplePeriod](ValueSample)
SSTDEVValue = std[SamplePeriod](ValueSample)

SMAvg = Average[SamplePeriod](AvgSample)
SSTDEVAvg= std[SamplePeriod](AvgSample)

SMDiff = Average[SamplePeriod](DiffSample)
SSTDEVDiff=std[SamplePeriod](DiffSample)

//Now use the standard TOS MACD to figure the current MACD to
//be standardized (converted to Z-score) later
Value = ExponentialAverage[fastLength](close) - ExponentialAverage[slowLength](close)
Avg = ExponentialAverage[MACDLength](Value)

Diff = Value-Avg

//Standardize the 3 outputs from the TOS MACD function
StandValue = (Value - SMValue)/SSTDEVValue
StandAvg=(Avg-SMAvg)/SSTDEVAvg
StandDiff=(Diff-SMDiff)/SSTDEVDiff

RETURN StandValue as "Signal-Z", StandAvg as "Average Signal-Z", StandDiff as "MACD-Z", 0 as "0", 1, -1, 2, -2, 3, -3
code adapted from Louis Sparks
Download
Filename:
MACD-Z.itf
Downloads:
185
Legend
I created ProRealCode because I believe in the power of shared knowledge. I spend my time coding new tools and helping members solve complex problems.
If you are stuck on a code or need a fresh perspective on a strategy, I am always willing to help. Welcome to the community!
Author’s Profile
Loading...