

MACD-V Volatility normalised Momentum
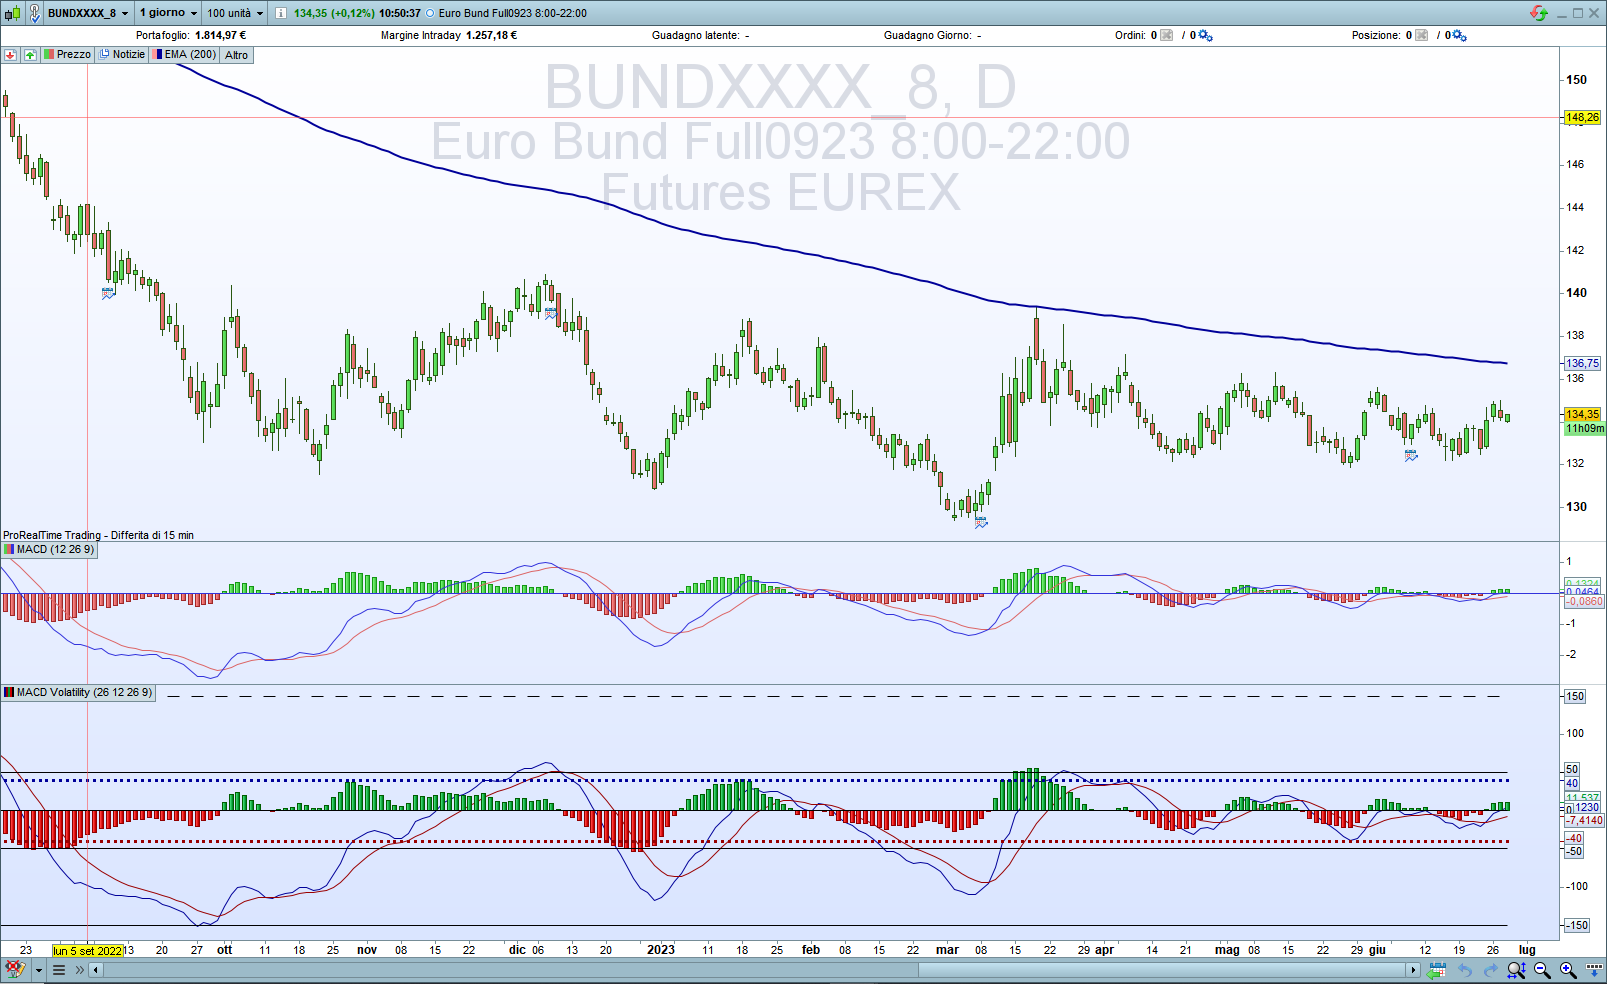
In the annual publication of the IFTA, year 2023, there is an interesting study by Alexandros Spiroglou (page 70-91) that solves some problems of the classic MACD through the modification of the formula with the use of the volatility of the asset under analysis. The main problems of the classic MACD are measurements over time, measurements in different markets, non-scalable momentum readings, signal line accuracy and timing. The proposed change is to divide the difference of the two ema, short minus long, by the ATR and multiply everything by one hundred.
The result, as is evident from the graphs, returns metrics that are not confined and free to move through the zero line, with areas of excess placed at 150/-150 and areas of attention at 50/-50.
I also added lines 40/-40 related to histogram attention areas.
The full reading of the article provides examples and metrics in large numbers on indices, bonds and commodities and further information on the use of MACD-V.
As exponential average periods change, so do the limits of excess and attention.
ifta.org/publications/journal/2023
// Indicatore MACD volatility creato 12/11/2022 studio IFTA 2023

EMAL=ExponentialAverage[emalunga](close) //default = 26
EMAB=ExponentialAverage[emabreve](close) //default = 12

Lineamacd=((EMAB-EMAL)/AverageTrueRange[periodoatr](close))*100 //ATR defalut = 26

EMAD=ExponentialAverage[emasegnale](Lineamacd) //default 9

Is=Lineamacd-EMAD
Return Lineamacd as "Macd line", EMAD as "Signal line", Is as "Istogramma", 0 as "linea0",40 as "isto40", 50 as "linea50",150 as "linea150",-40 as "isto-40",-50 as "linea-50",-150 as "linea-150"