

Macd-Squeeze.
March 29, 2019, 8:22 AM
Indicators
10 Comments
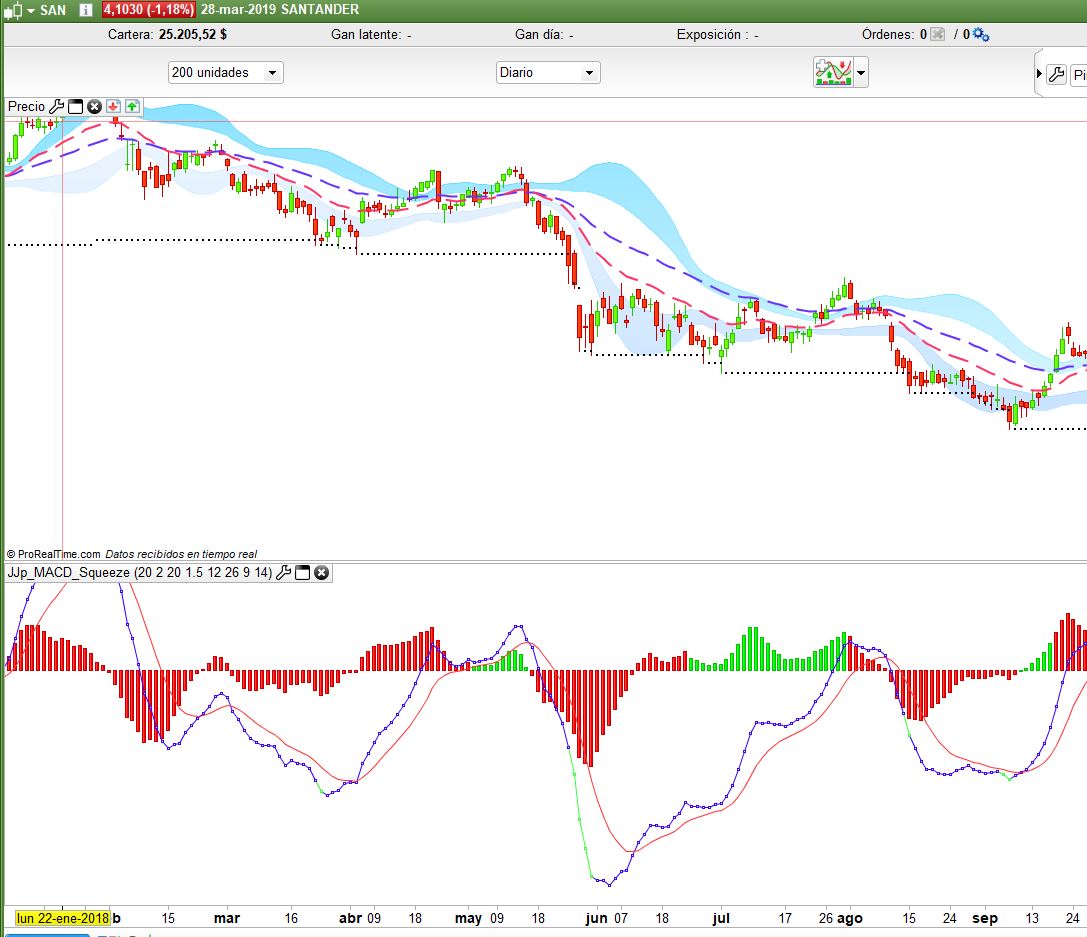
Hi, I leave a very practical modification of Macd and Squeeze, the MACD histogram is colored in red or green depending on whether the squeeze is active or not. Additionally, the MACD line is colored green if the RSI is oversold or red, if it is in overbought.
// JJP- Marzo 2019.

// Settings
Length=20
mult=2
lenghkc=20
Multkc=1.5
Macdcorta=12
Macdlarga=26
Macdsignal=9
PeriodoRSI=14
sobreventaRSI=70
SobrecompraRSI=30

//Squeeze.
//BB
basis = average[length](close)
dev = mult * Std[length](close)
upperBB = basis + dev
lowerBB = basis - dev

//KC
ma = average[lengthKC](close)
myrange = range[lengthKC]
rangema = average[lengthKC](myrange)
upperKC = ma+rangema * multKC
lowerKC = ma-rangema * multKC

sqzOn = (lowerBB>lowerKC) AND (upperBB<upperKC)

if(sqzOn=1) then
 scolorR = 0
 scolorG = 300
else
 scolorR = 255
 scolorG = 0
ENDIF


REM MACD
myMACD=exponentialaverage[MACDCorta]-exponentialaverage[MACDLarga]
signal=exponentialaverage[MACDSignal](myMACD)

Osma=mymacd-signal


// RSI
MyRSi=rsi[PeriodRSI](close)

if MyRsi>70 then
 r=255
 g=0
 b=0
endif
if MyRSI<30 then
 r=55
 g=255
 b=55
endif

if myRSI>30 and myrsi<70 then
 R=55
 g=0
 B=255

endif


return osma coloured(scolorR,scolorg,0) style(histogram) as "Osma_Sque", mymacd coloured (r,g,b)as "macd", signal as "Signal"
Download
Filename:
JJp_MACD_Squeeze.itf
Downloads:
506
Veteran
As an architect of digital worlds, my own description remains a mystery. Think of me as an undeclared variable, existing somewhere in the code.
Author’s Profile
Loading...