MACD Impulse Elder divergences

MACD Impulse Elder divergences

I use it exclusively for the DAX, and timeframes of 1 and 5 minutes, although I suppose in longer times also work.

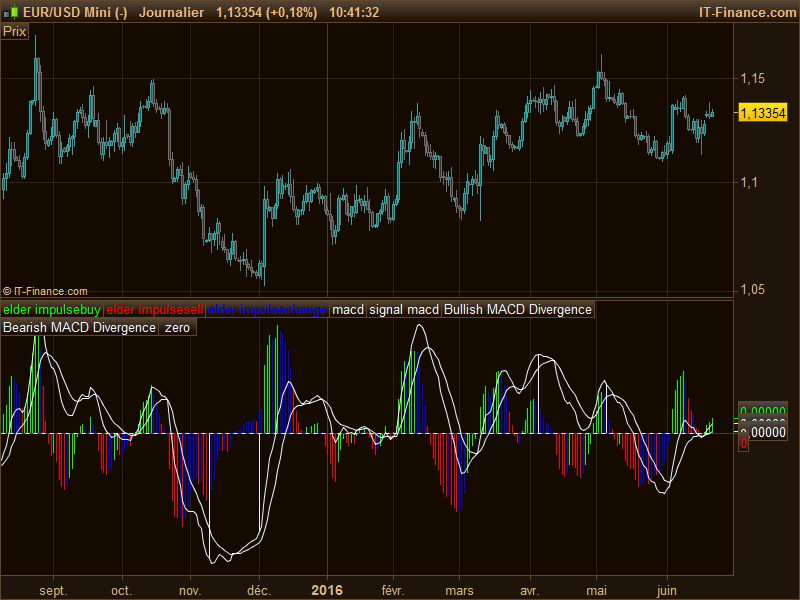
About the MACD I do not think there’s much to explain. I do not use it as the sole indicator, of course, but it is a good complement to detect differences, and it also helps the automatic detector thereof. When the histogram rises, albeit negative, it’s time for long, but I repeat that it is not the indicator that entry. What is interesting are the bars with colors: according to the Elder Impulse System, if the bar is blue, is indifferent, although it may help seeing the previous trend. If the bar is red, it prohibits long and recommends short, and if the bar is green, prohibits short and long recommended. I hope to see two or three green candles in a row to go long or short red. The Elder Impulse System is a combination of momentum and trend. The ideal for long time is when the histogram rises, the candle is green just above zero and there is a divergence above. Ditto for short, but in reverse. Should confirm the differences visually. Naturally, the higher will be the histogram bars, the more the price goes up. If you are long and bar turns red, it is out.

I know it’s very simple, but as I practiced with this indicator (along with others), works for me.

MACD divergences are also spotted in this indicator (white histograms in the screenshot).

The first 3 variables must be rendered as histogram, along with the divergences variables too.


Share this

Risk disclosure:

No information on this site is investment advice or a solicitation to buy or sell any financial instrument. Past performance is not indicative of future results. Trading may expose you to risk of loss greater than your deposits and is only suitable for experienced investors who have sufficient financial means to bear such risk.

ProRealTime ITF files and other attachments : How to import ITF files into ProRealTime platform?

PRC is also on YouTube, subscribe to our channel for exclusive content and tutorials

  1. ade1 • 06/21/2016 #

    I HAVE BEEN USING YOUR INDICATOR WITH THE STOCHASTIC .IT IS AMAZING.
    THANKYOU

  2. CapitanNemo • 06/21/2016 #

    l’indicatore che mi viene fuori senza modificare il codice è diverso dall’immagine che vedo ed è sicuramente sbagliato. Non so come gestire le 4 variabili iniziali messe con //. Cioè pc, pl, ps, p. Come devo usarle nel codice? Putroppo non riesco neanche a mandarvi uno screenshot del mio grafico perché il sistema mi dice che non sono autorizzato a farlo. Attendo qualche suggerimento. Grazie.
    Capitan Nemo

  3. Petrus • 06/21/2016 #

    Ciao Capitan Nemo.
    I would not change these 4 variables, as they are the standard ones for the normal MACD (pc, pl, and ps) and for the Elder Impulse System (p).
    But if you really want to change them and play with other values, you have to delete the lines 8 to 11, and put these 4 values in the indicator as variables (Add on the programming window), and then you can put there any value you want.
    I also don’t know how to include a photo of the graphic in this comment, but if you send me your mail, I will send you these possibilities.

  4. pieropadova • 06/21/2016 #

    le variabili poi le ho capite ad una più attenta rilettura, scusami, ma il grafico mi viene tutto diverso. Non ci sono le barre colorate verticali, solo tante curve oscillanti.
    Non ho la tua mail, dove la trovo? Grazie. Scrivi a pieropadova@gmail.com.

  5. TinoV1969 • 06/21/2016 #

    @ade1 – I can run it with stochastic not to got – tino.viehweg1969@gmail.com

  6. RECALL • 06/21/2016 #

    Newbie in prt use, could you give me the best way (condition) for creating a signal directly in the principal bar charts screen
    Thanks for this wonderfull job

    • Nicolas • 06/21/2016 #

      You should use the forum instead for this question, since it doesn’t have any relation to this post specifically. Thanks.

  7. RECALL • 06/21/2016 #

    Sorry

  8. leofib • 06/21/2016 #

    HI and thank you very much for the MACD H Divergence scanner, I was badly lookin for it! Could you code a different version using the normal MACD instead of the MACD LAG? Thanks!

  9. Petrus • 06/21/2016 #

    The curves MACD and signal, and the MACD histogram are calculated using the normal MACD (lines 13, 30 and 33 of the code) , not the Zero Lag. The Zero Lag is used only used to calculate the divergences. But the most useful indication of this indicator is the normal MACD combinated with the Elder Impulse system.
    If you want more information about the divergences, you can see following links:
    http://www.prorealcode.com/prorealtime-indicators/divergences-rsx/
    http://www.prorealcode.com/prorealtime-indicators/macd-divergences-from-price/
    http://hk-lisse.over-blog.com/search/divergences%20macd/
     

  10. leofib • 06/21/2016 #

    Hi Petrus and thanks for reply. I was indeed talking about the divergence scanner which, as you coded it, it uses the Lagged MACD instead of the plain MACD which is the one used by the divergence scanner coded by Elder for Tradestation.
    I already use the Impulse system combined in the Triple Screen for my trading but was looking for a PRT version of the MACD divergence scanner to look for potential/running divergences and that’s why I asked you.
    Thanks again

  11. Petrus • 06/21/2016 #

    Hi leofib.
    As I explained on the text, I did not code this scanner, I only adapted it from the first link, who also adapted it from a code of HK-LISSE (3rd link). But be careful: the divergence indicator works ok, but not on the 100% of the cases. They have to be confirmed visually, on the graph. It should be only used as a warning. And of course, even if the divergence are confirmed, not always are they giving the right information. You can sometimes get a clear bullish divergence, having in the near time a big bullish trend.

  12. leofib • 06/21/2016 #

    Hi Petrus, yes I noticed it sometimes misses a major divergence but I would say it takes about 90% of the MACD H divergences, but a couple of bar later than the same divergence signaled by the plain MACD.  It has to be followed “by hand” of course but it would be of great help having this scanner working with the plain MACD just to let it do the gross job. I wonder if you can help with this as I am not good at all in coding. Thanks!

  13. Petrus • 06/21/2016 #

    Hi leofib.
    To use the normal MACD for the divergences, you only have to change in line 54
    x=hh (instead of ZeroLagMACD)-> this is the normal MACD of line 30
    and in line 55
    y=hh1 (instead of  SignalMACD)-> this is the normal Signal of line 33
    After that, you have only to eliminate (or write REM or // on the start of the lines) the lines 35 to 53.
    That’s all. And I have tested it and it works.

  14. leofib • 06/21/2016 #

    Thnak you Petrus. I adapted your code as you suggested and noticed that by using the normal MACD it misses a great number of divergences which are on the other side correctly detected by the Zerolag MACD version, even if with a couple of bars laters.
    In other words, the normal MACD H version is much less precise than the Zerolag Version. Could it be that it requires some other modification?
    Thanks for your patience

  15. Petrus • 06/21/2016 #

    Exactly leofib!! That’s the reason for using the ZeroLag.
    As in many other indicators, if you reduce the number of periods or if you want they faster, it becomes more nervous but they anticipate the information, although you have to pay the price of giving some fake signals. There is no other solution.
    If you read the code, even the signal (in both, normal MACD and ZeroLag) are nothing but an exponential average over the MACD or ZeroLag: that means, they smoothed the nervous curve. ZeroLag, as the name tells, will be always faster than the normal MACD and will give signals that the normal MACD cannot see. However, I think that the difference between both are really not so critical.

  16. leofib • 06/21/2016 #

    Thanks Petrus, However I  think the problem is not with how fast they are but I suspect your code has been written considering the MACD Lag. I’ll try to explain.
    I noticed that your original code (which follows the Zerolag), signals a divergence as soon as the MACD H turns positive (or negative), i.e. when it corss the zero line.
    By using the original MACD H, and following Elder’s instruction, you have a divergence when the MACD H TICKS UP (or down) independently on being above or below the (normal) MACD H.
    Thus, the problem could be that you have coded your indicator by giving a divergence signal when it crosses the zero line and not when it ticks up or down from a previous bar. I’m not able to verify this by reading your code but what you believe?
    Thianks again!

  17. Petrus • 06/21/2016 #

    Hi again. The problem is that I did not analyze the code because I did not code it: I simply adapted it from the first link I gave you before.

  18. leofib • 06/21/2016 #

    Ok sorry I missed this part.
    Well if you are interested in coding a correct MACD H scanner (by correct I mean a scanner following Elder’s rules) please let me know, provided that you are not already fully aware of what these rules are 🙂
    Thanks again Petrus

    • franciscojbritop • 06/21/2016 #

      Hi Leofib,
      Did you finally find a screener following Elder MACD-H divergences? If so, could you please share with me? I appreciate your support!!

  19. gabri • 06/21/2016 #

    Thanks for the code, excellent work.  I remember Elder suggesting to use this system on the second timeframe higher to the one you use for trading (i.e. if you trade on an hourly timeframe you should get this indicator running out of the weekly charts and use a force index indicator out of the daily one).  Since PRT doesn’t allow multi frames yet I suggest to keep the daily timeframe running (like you did) and change the settings as folllow by multiply the current settings by a factor of five:
    pc=60 pl=130 ps=20 p=65The graph you obtain represents very well a weekly macd and EMA13 on a daily frame.CheersGabriele

  20. ancapreb • 06/21/2016 #

    Thanks a lot for the indicator. It is essential in my strategy….
    And I have a request if someone can help me with the coding…
    For me it would be really helpful if the Histogram would change colors depending on the difference with the previous bar as well.
    I mean, if the histogram is blue and the next bar is still blue but with a lower value, then it would be colored in a lighter blue or if it has a higher value in a stronger blue.
    I don’t know if it is possible….

    Thanks in advance.

  21. Alessandro47 • 06/21/2016 #

    Hi Petrus thank you so much for your indicator, very helpful.

avatar
Register or

Likes

avatar avatar avatar avatar avatar avatar avatar avatar avatar avatar avatar avatar avatar avatar avatar avatar
Related users ' posts
RGKP Hi Vonasi, great work! But what I do not understand is that the statistics change according ...
mr_delta Hi https://www.prorealcode.com/user/vonasi/ I am interested in in scanning for a similar set...
Vonasi Minor Bug Fix Please download an updated version with a minor bug fix from here: https://www...
ALE Very Very Nice
manel Hi - Many thanks for this and your other analytical codes, stellar work - very useful ! With...
Vonasi Good idea Manel. I have posted a new version here that shows results as a percentage: https:...
mathiasKN Steffen Schmauch • 12/11/2018 # hello Nicolas, can I change the indicator that I only get t...
Nicolas Please open a new topic in the indicator forum and explain there your query, thank you.
upupandaway This seems like a very useful indicator. However, it does not seem to open properly in the c...
Choliver HI, Thanks a lot Good job. :-)
mscharstrom Hi @robertogozzi, I really love this indicator. However, I'd like to tinker with it to fit ...
Ahimsa Hi Roberto I cannot thank you enough for writing this code. It could help me more than you ...
Nicolas With PRT v11, you have to click on "price" at the upper left side of the price chart.
robertogozzi Firstly you need to make the correct calculation, you need to swap 22 and 7. Secondly PRT's...
SB-FO Sorry, i did forget to change the 7/22, I have run it both ways. PRT is calculating PPO a...
RubberToe I believe there is an error in line 23 of the MACD version. It points to the FastP. Should...
Leo I don't know, I just copy paste the strategy. The optimisation of the values I wrote them in...
bertrandpinoy hello Leo I'm spending time on your strategy code. do you agree to try to include this code ...
bertrandpinoy //version a: ajout filtre MM defparam cumulateorders=false // --- paramètres taille =...
Bard Problems with Safari latest s/ware and this site and links and adding code. Let me add the...
grimweasel47 Ok thanks Nicolas - could this be adapted to take into account MFI and then have price, volu...
Nicolas I don't understand what you mean exactly, would be better to open a topic about this idea wi...
Jesper Great share!
capgros Bonjour @Nicolas, Thanks a lot for this tool, it is very useful for me. I would like to s...
Hans63 Would you add the possibility to color also the Heikin Ashi and bar chart?
Nicolas That's possible, please open a new topic in the indicator forum explaining what you need exa...
Nicolas Change line 62 with: drawcandle(flup,fldn,flup,fldn) coloured(169,169,169,80) bordercolor(16...
DimKar Thank you very much from Greece sir , have a nice day ....!!!! Really i do not have words...
mit_ose Bonjour, J'ai d'excellents résultats avec cet indicateur simple et efficace; Merci beaucoup;
3agl3 voglio l indicatore
Victor.Strand Hi Pableitor, the code is just great; i was playing a lil bit with these factors, darwsegmen...
micky_red Hi, I have tried to use this indicator in version 12 and it doesn't work. Do you know how...
Victor.Strand Hey Micky, indicator works well, justpaste the code on the platform, or save it as an "itf" ...
ottimo Thank you Nicolas, great indicator, N. 1
tikigai Merci Nicolas! First Happy new Year 2020. Very good indicator BUT (yes the french "oui, m...
Nicolas Whats prorealtime version? Did you try in version prior to v11? indicator's call and loop ca...
jissey Bonjour Bolsatrilera,j'essaie de vous contacter pour le cm rsi ;je le trouve interessant, m...
jissey J'essaie de vous contacter pour l'indicateur"cm rsi"....
Vonasi No problem pableitor - I'm glad you like it.
pableitor Hi Vonasi, I was checking a few random weeks with your indicator and sometimes it seems to ...
Vonasi I have not checked your query on a chart but my guess is that you are reading the indicator ...
Nicolas Yes, that's how it goes when using loops..
JosephFelix Hi, Could I please have help with adding these indicators 'on price'? Every indicator that I...
Nicolas Just add it on price by clicking the wrench on the left upper side of the price chart.
Nicolas Thanks for create a specific thread in the forum in order to handle your coding query. I see...
Victor.Strand Thanks Nicolas, I didnt know there was a multitimeframe support now... I will check it. This...
Nicolas to return a value of a Close of timeframe 1-hour, for instance : TIMEFRAME(1 hour) c = close...
lokbuscas is it possible to make a screener with this conditions??? thank you
achel I believe so but I leave it to Nicolas to decide if it is possible
Nicolas Please open a new topic in the screeners forum

Top