

Mean MA Deviation
April 16, 2018, 3:24 PM
Indicators
2 Comments
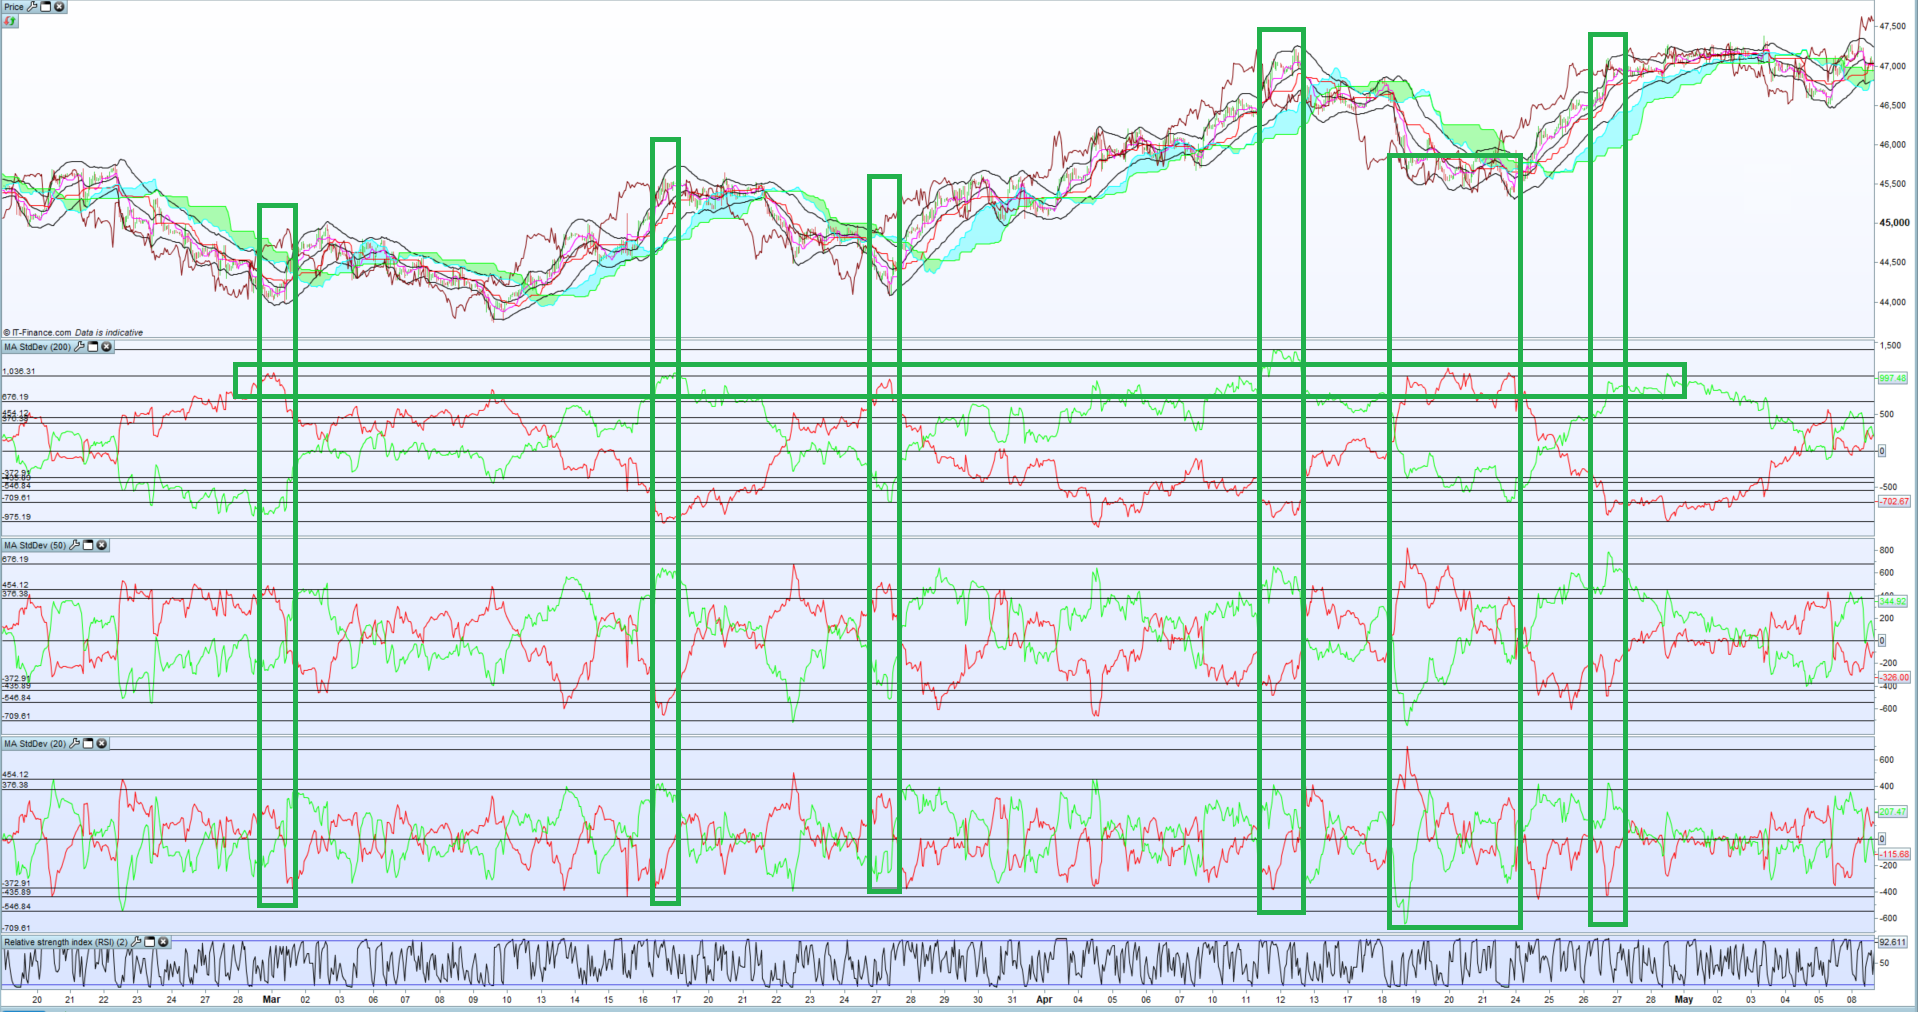
I have created this Indicator based on the concept of mean reversion. The indicator measures the distance from the Moving Average and allows the trader to plot horizontal support and resistance lines based on the historical levels of maximum deviation.
Multiple sets of the indicator can be added based on different Moving Averages. In the example above I have added a set for the 200MA, 50MA and 20MA.
The idea is that if the standard deviation of multiple MA’s are being challenged, the price is likely due a pullback or a possible direction change might be imminent.
Input includes the Moving Average Period as ‘MAPeriod’ (Default is set to 200).
HDev = average[MAPeriod](close)+1*STD[MAPeriod](average[MAPeriod](close))
LDev = average[MAPeriod](close)-1*STD[MAPeriod](average[MAPeriod](close))

Return HDev-high coloured(255,0,0) AS "Hdev", low-LDev coloured(0,255,0) AS "Ldev", 0 coloured(0,0,0) AS "0"
Download
Filename:
MA-StdDev.itf
Downloads:
172
Master
My name is Juan Jacobs and I am an algorithmic trader and trading coach. After 7 years of corporate work as a Systems Analyst, I have decided to pursue my passion of trading on a full-time basis. My current focus area is that of 'smart' strategies based on 'Machine Learning'. You can find me at www.FXautomate.com or visit my PRC Marketplace Store here: https://market.prorealcode.com/store/fxautomate/
Author’s Profile
Loading...