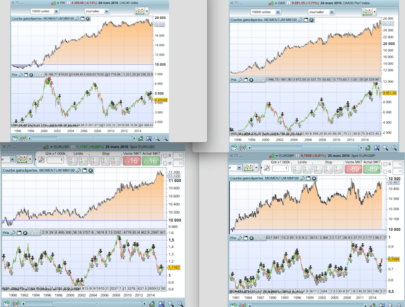
M-Oscillator

M-Oscillator

M – Oscillator

An improvement of the Momentum Oscillator – Published on IFTA Journal 2018 by Mohamed Fawzy (pages 28-53)

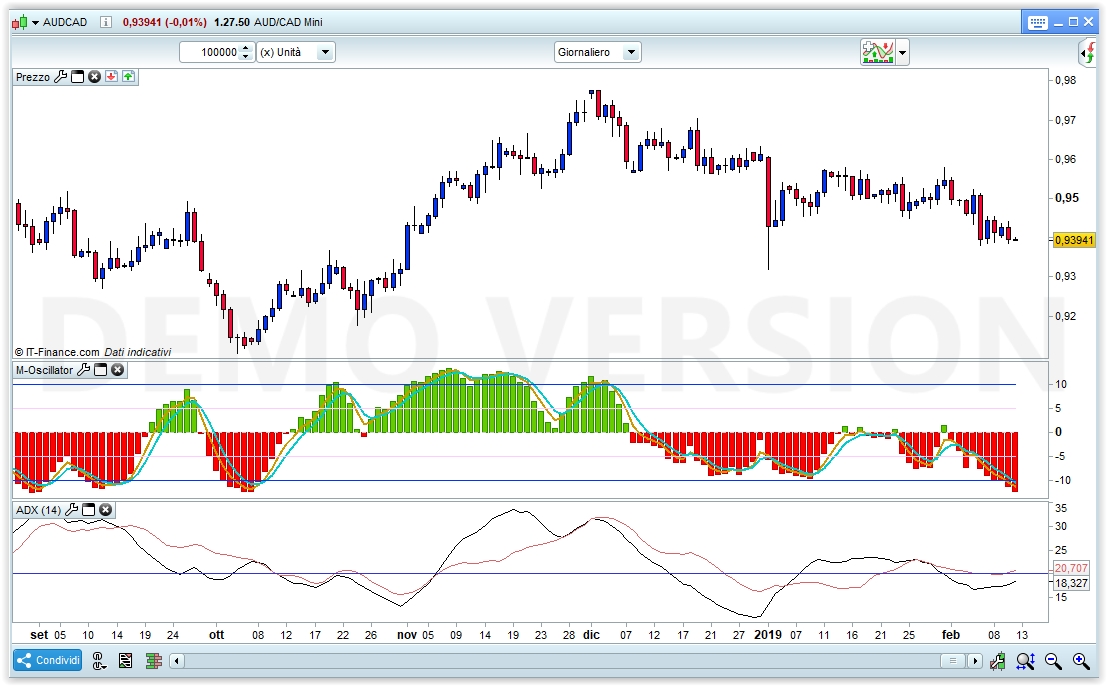
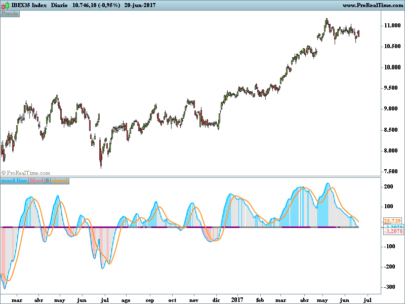
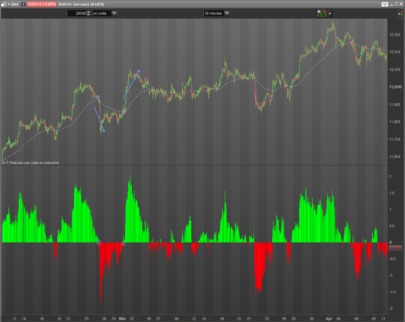
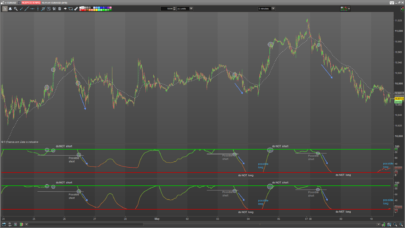
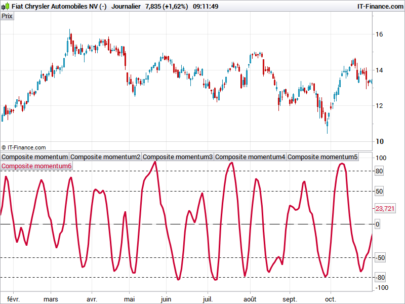
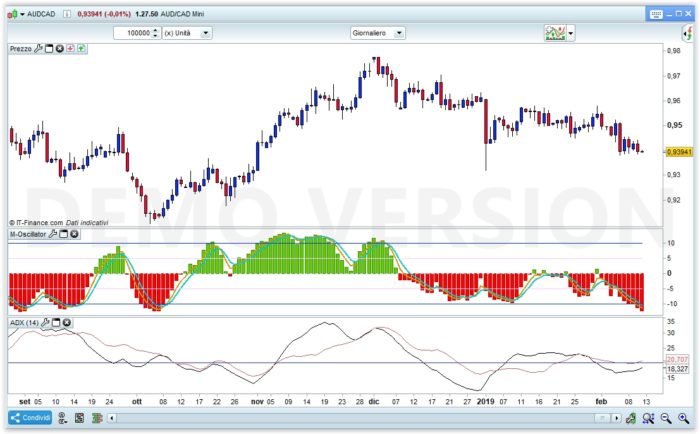
a value > 10 is considered OverBought
a value < -10 is considered OverSold

In sharp upward moves the M-Oscillator ranges from 5 to 14
In sharp downward moves the M-Oscillator ranges from -5 to -14
In an UpTrend value ranges from 0 through 14
In a DownTrend value ranges from 0 through -14

Usually a SHORT signal is generated when, after entering the OB area, the M-Oscillator re-crosses it downwards
Usually a LONG signal is generated when, after entering the OS area, the M-Oscillator re-crosses it upwards
(such indications are valid in sideways markets, because in trending markets, values may remain in the OS/OS area
for quite a long time)
ADX can be used in conjunction to detect a range when its value is < 25

Divergences, like for other oscillators, can be taken advantage of.

Share this

Risk disclosure:

No information on this site is investment advice or a solicitation to buy or sell any financial instrument. Past performance is not indicative of future results. Trading may expose you to risk of loss greater than your deposits and is only suitable for experienced investors who have sufficient financial means to bear such risk.

ProRealTime ITF files and other attachments : How to import ITF files into ProRealTime platform?

PRC is also on YouTube, subscribe to our channel for exclusive content and tutorials
  1. luxrun • 02/19/2019 #

    Per coloro che volessero approfondire questo oscillatore e leggersi tutto lo studio dell’autore sull’IFTA Journal 2018, ecco il link: http://www.ftaa.org.hk/Files/2018130101754DGQ1JB2OUG.pdf

  2. luxrun • 02/19/2019 #

    Grazie Roberto!

  3. robertogozzi • 02/19/2019 #

    Grazie luxrun

  4. robertogozzi • 02/19/2019 #

    The above link is to the IFTA Journal as reported on the indicator

  5. andyj • 02/19/2019 #

    Fantastic indicator, how would you create a screener to filter stocks when the signal line crosses above zero, thanks Andy

    • robertogozzi • 02/19/2019 #

      Sorry for my late reply. I’ll make it and open a new topic quite soon.

  6. gabri • 02/19/2019 #

    This is a rally interesting indicator. I read the whole article and I tried to run some quick backtest. The results are very variable. What I noticed though is that if the Ichimoku Kumo is used to define the trend (and not the EMA60) the percentage of winning trades increases significantly and also the gain per trade….food for thoughts 🙂

  7. swapping • 02/19/2019 #

    ah ah ! je n’avais pas vue celui-ci, excellent robert 😉

avatar
Register or

Likes

avatar avatar avatar avatar avatar avatar avatar avatar avatar avatar avatar avatar avatar avatar
Related users ' posts
Lotech123 Thanks for this indicator. Working on a 3 M timeframe with the DJI, it can produce some inte...
JSTAR PRODUCTIONS Hi there, I downloaded the Indicator but the indicator does not show up on my charts. Am...
JSTAR PRODUCTIONS Hi, Worked it out. Thanks
Jean-Pierre Poulain When I buy and when I sell ?
Nicolas The featured image of the post do not deserve the indicator you are right, I attached other ...
Nicolas It is described in the post already :) The BUY/SELL signals are quite similar of what you ca...
Nicolas We do not offer free assistance for TOS. However, you can send demand for private paid codin...
phanz Hi community. May I know how you use this indicator please? Is it on the zero cross over? ...
sydney43025 Hello, I'm digging up this topic because I uploaded the code on a PRT v11.1 but the indicato...
finplus Thanks for the job. Which variables do you suggest for timeframe 1 hour? 
Maz Depends massively on your market and the volatility. I suggest using the variable optimizer ...
1Randy This a great momentum filter! I would like to see volume momentum incorporated into the indi...
Jodal Bonjour Nicolas, Merci pour cet indicateur! Est-ce possible de configurer une alerte pou...
Nicolas Merci pour le post dans le forum en respectant les règles de publication énoncées dans le ca...
Dron De lo mejorcito
Swingforfortune
7 years ago
gatarayihajp Hi swingforfortune, Thanks a lot about your interesting posting. Let ask you to explain mor...
Swingforfortune Hello. Basically they are a twist of the MACD histogram and can be used as such. They visua...
gatarayihajp Hi again Thanks for the explanation. Have a good day
Nicolas All conditions under parenthesis for the c1 to c4 conditions should be inverted. 
tomus Can you give an example of the overbought codes please? Thanks.
ams123 Frank Merci Nicholas -:)
Wilko And not only readable.... makes it much easier to iterate different entry/exit-conditions, d...
IGOSNELL Hi Interesting strategy, when I used $ M-R Dif EURUSD M15 Long if does not enter any positi...
ilvillans HI, I modified the system, from good results but from this error: Replace the variables wit...
gabri
7 years ago
Marcel Thank you for this one. I played around with this indicator with Bollinger Bands around it i...
Nicolas
7 years ago
supertiti bonjour à tous J'utilise cet indicateur depuis plusieurs mois, une fois règlé "K" à sa conv...
Nicolas
7 years ago
T3 Velocity
T3 Velocity
16
Indicators
tatankayotanka As you can do to set a marker directly in the price property page and then view it such as m...
Nicolas It may be a good idea to discuss this in the forum instead. Please open a new topic in probu...
Wester Hi, is this more or less the same as the TTM Squeeze indicator (john carter)
rpreviteri Hi Nicolas, thanks a  loto for sharing your knowliedge, Wasn't the original momentum pinball...
air Thank you!  
elanoa Buonasera sig. Nicolas......sarebbe possibile far in modo che quando l'indicatore raggiunga ...
Doctrading I forgot to write at the beginning :  a = 50 b = 50 These are intermediate levels Sorry
DerPat Thank you. This one could be an aid in my current research on stochastics.
Pelayo it is possible that in line 12 we should put seuilinf=-b, thaks for all
lglmrc Can't make it work, says: "Define p variable"
Ezio Hi Xel and thanks, do you know if there is a way in PRC of reading/counting intraday ticks?...
inadis ive just discovered this, i must say very nice thanks.
phili711 Bonjour Si la moyenne 100 est au dessus de la moyenne 20 le trend est baissier zlors pourqu...
Nicolas La comparaison se fait entre la valeur de la moyenne actuelle et telle qu'elle était il y a ...
Thomas007 we should definitely open a new thread for intraday trading - can we post the link once it's...
Vicari0us Really liking this indicator. Thanks
SB-FO Moving your last response to this post. Thanks for conforming the code below. How does PRT/...
Nicolas It is obtained by substracting the x days before Close from today’s Close. X is the paramete...

Top