

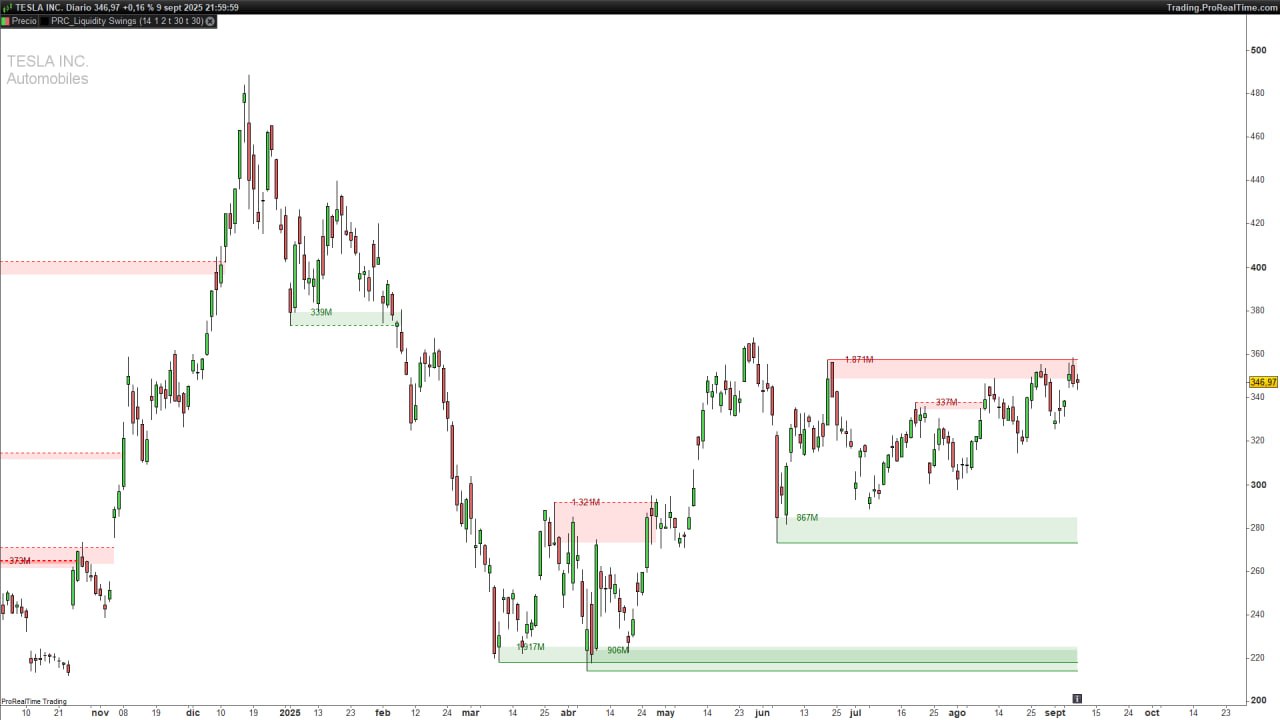
Liquidity Swings
1. Introduction
In the world of technical analysis, understanding where liquidity clusters can offer a powerful edge. These zones, often located around swing highs and lows, reveal areas where price has previously reacted strongly—either through rejection or breakthrough. The Liquidity Swings indicator (by LuxAlgo) is designed to visualize these key price zones, highlighting areas of potential support and resistance based on historical pivot points and volume interaction.
2. How the Indicator Works
The Liquidity Swings indicator identifies pivot highs and pivot lows based on a configurable lookback period. Once these pivot points are detected, the script begins to monitor how price interacts with those levels:
-
Touches: When price enters the defined liquidity zone but does not break through.
-
Crosses: When price decisively breaks beyond the liquidity zone.
For each pivot, the indicator keeps track of:
-
The number of touches.
-
The volume during these touches.
-
Whether the zone was eventually broken.
Once a zone is broken or has received enough interactions (touches), it is visualized on the chart with dynamic segments and rectangles to highlight the area.
This dual-layered logic allows traders to differentiate between respected zones (untouched) and weakened or broken zones (crossed).
3. Indicator Parameters
The indicator offers several parameters that allow for full customization:
-
length(default:14)
The number of bars used to identify pivot highs/lows. Higher values make the indicator detect more significant, less frequent pivots. -
areaType(default:1)
Defines how the liquidity zone is drawn:-
1: Wick extremities (from high to candle body). -
2: Full range (from high to low).
-
-
filterValue(default:2)
Minimum number of touches required for a zone to be displayed.
Display Settings
-
showTop(default:1)
Enable or disable resistance zones (pivot highs). -
topAreaAlpha(default:30)
Transparency level for the red resistance area (0–255). -
showBtm(default:1)
Enable or disable support zones (pivot lows). -
btmAreaAlpha(default:30)
Transparency level for the green support area (0–255).
4. Chart Interpretation
Once applied, the indicator highlights liquidity zones using a color-coded system:
-
Resistance Zones (Pivot Highs):
-
Red dotted line: broken liquidity level.
-
Red rectangle: area from top wick to body or full range.
-
Label above the zone shows total volume accumulated from touches.
-
-
Support Zones (Pivot Lows):
-
Green dotted line: broken liquidity level.
-
Green rectangle: support area.
-
Label below the zone shows volume data.
-
If the zone hasn’t been broken but has sufficient touch count, the indicator draws the segment until the current bar, allowing traders to assess ongoing respect for the zone.
This allows for intuitive visualization of both historical significance and current relevance of price zones.
5. Configuration Tips
-
Increase
filterValueto 3 or more to reduce noise and focus on high-importance zones. -
If you’re only interested in resistance, disable
showBtm, and vice versa. -
Adjust
topAreaAlphaandbtmAreaAlphafor better integration with your chart’s background.
6. ProRealTime Code
//-----------------------------------------//
//PRC_Liquidity Swings by LuxAlgo
//version = 0
//05.09.2025
//Iván González @ www.prorealcode.com
//Sharing ProRealTime knowledge
//-----------------------------------------//
defparam drawonlastbaronly=true
//-----------------------------------------//
// --- Parámetros de Configuración ---
//-----------------------------------------//
length = 14 // Pivot Lookback
areaType = 1 // Swing Area: 1 = Wick Extremity, 2 = Full Range
filterValue = 2 // Mostrar solo zonas con un conteo/volumen mayor a este valor
//// --- Estilos ---
showTop = 1
topAreaAlpha = 30 //0 - 255
showBtm = 1
btmAreaAlpha = 30 //0 - 255
//-----------------------------------------//
// --- Inicialización de Arrays ---
//-----------------------------------------//
ONCE phCount = 0
ONCE plCount = 0
//-----------------------------------------//
// --- FASE 1: Creacion de Arrays
//-----------------------------------------//
isPivotHigh = (high[length] = HIGHEST[2*length+1](high))
isPivotLow = (low[length] = LOWEST[2*length+1](low))
// Almacenar nuevo Pivote Alto
IF isPivotHigh THEN
$phTop[phCount] = high[length]
IF areaType = 1 THEN
$phBtm[phCount] = MAX(close[length], open[length])
ELSE
$phBtm[phCount] = low[length]
ENDIF
$phLeft[phCount] = barindex[length]
$phRight[phCount] = barindex[length-1]
$phCrossed[phCount] = 0
$phTouchCount[phCount] = 0
$phTouchVolume[phCount] = 0
phCount = phCount + 1
ENDIF
// Almacenar nuevo Pivote Bajo
IF isPivotLow THEN
$plBtm[plCount] = low[length]
IF areaType = 1 THEN
$plTop[plCount] = MIN(close[length], open[length])
ELSE
$plTop[plCount] = high[length]
ENDIF
$plLeft[plCount] = barindex[length]
$plRight[plCount] = barindex[length-1]
$plCrossed[plCount] = 0
$plTouchCount[plCount] = 0
$plTouchVolume[plCount] = 0
plCount = plCount + 1
ENDIF
//-----------------------------------------//
// --- FASE 2: Dibujo
//-----------------------------------------//
IF islastbarupdate  THEN
// Procesar Zonas de Resistencia
if showTop then
FOR i = 0 TO phCount-1 DO
dist=barindex-$phLeft[i]
// Localizar el punto de ruptura
for j=dist downto 1 do
if $phCrossed[i] = 0 and close[j] > $phTop[i] then
$phCrossed[i] = 1
$phRight[i] = barindex[j]
break
elsif $phCrossed[i] = 0 and high[j] > $phBtm[i] and low[j]<$phTop[i]  then
$phTouchCount[i] = $phTouchCount[i]+1
$phTouchVolume[i] = $phTouchVolume[i]+volume[j]
endif
next
//Dibujar el nivel de liquidez
vol=$phTouchVolume[i]
if $phCrossed[i]=1 and $phTouchCount[i]>filterValue then
drawsegment($phLeft[i],$phTop[i],$phRight[i],$phTop[i])style(dottedline)coloured("red")
drawrectangle($phLeft[i],$phTop[i],$phRight[i],$phBtm[i])coloured("red",0)fillcolor("red",topAreaAlpha)
drawtext("#vol#",$phLeft[i]+7,$phTop[i])coloured("darkred")
elsif $phCrossed[i]=0 and $phTouchCount[i]>filterValue then
drawsegment($phLeft[i],$phTop[i],barindex,$phTop[i])style(line)coloured("red")
drawrectangle($phLeft[i],$phTop[i],barindex,$phBtm[i])coloured("red",0)fillcolor("red",topAreaAlpha)
drawtext("#vol#",$phLeft[i]+7,$phTop[i])coloured("darkred")
endif
NEXT
endif
//-----------------------------------------//
// Procesar Zonas de Soporte
if showBtm then

FOR i = 0 TO plCount - 1 DO
dist2=barindex-$plLeft[i]
// Localizar el punto de ruptura
for j=dist2 downto 1 do
if $plCrossed[i] = 0 and close[j] < $plBtm[i] then
$plCrossed[i] = 1
$plRight[i] = barindex[j]
break
elsif $plCrossed[i] = 0 and low[j]<$plTop[i] and high[j]>$plBtm[i] then
$plTouchCount[i] = $plTouchCount[i]+1
$plTouchVolume[i] = $plTouchVolume[i]+volume[j]
endif
next
//Dibujar el nivel de liquidez
vol2=$plTouchVolume[i]
if $plCrossed[i]=1 and $plTouchCount[i]>filterValue then
drawsegment($plLeft[i],$plBtm[i],$plRight[i],$plBtm[i])style(dottedline)coloured("green")
drawrectangle($plLeft[i],$plBtm[i],$plRight[i],$plTop[i])coloured("green",0)fillcolor("green",btmAreaAlpha)
drawtext("#vol2#",$plLeft[i]+7,$plTop[i])coloured("darkgreen")
elsif $plTouchCount[i]>filterValue then
drawsegment($plLeft[i],$plBtm[i],barindex,$plBtm[i])style(line)coloured("green")
drawrectangle($plLeft[i],$plBtm[i],barindex,$plTop[i])coloured("green",0)fillcolor("green",btmAreaAlpha)
drawtext("#vol2#",$plLeft[i]+7,$plTop[i])coloured("darkgreen")
endif
NEXT
endif

ENDIF
//-----------------------------------------//
RETURN
7. Conclusion
The Liquidity Swings indicator offers a visually intuitive and algorithmically robust way to detect and analyze areas of significant price interaction. By combining pivot structure with touch count and volume filtering, it enables traders to better anticipate where the market is likely to find support or resistance.
Whether used standalone or in combination with other tools, this indicator can become an essential part of your technical analysis workflow.
