

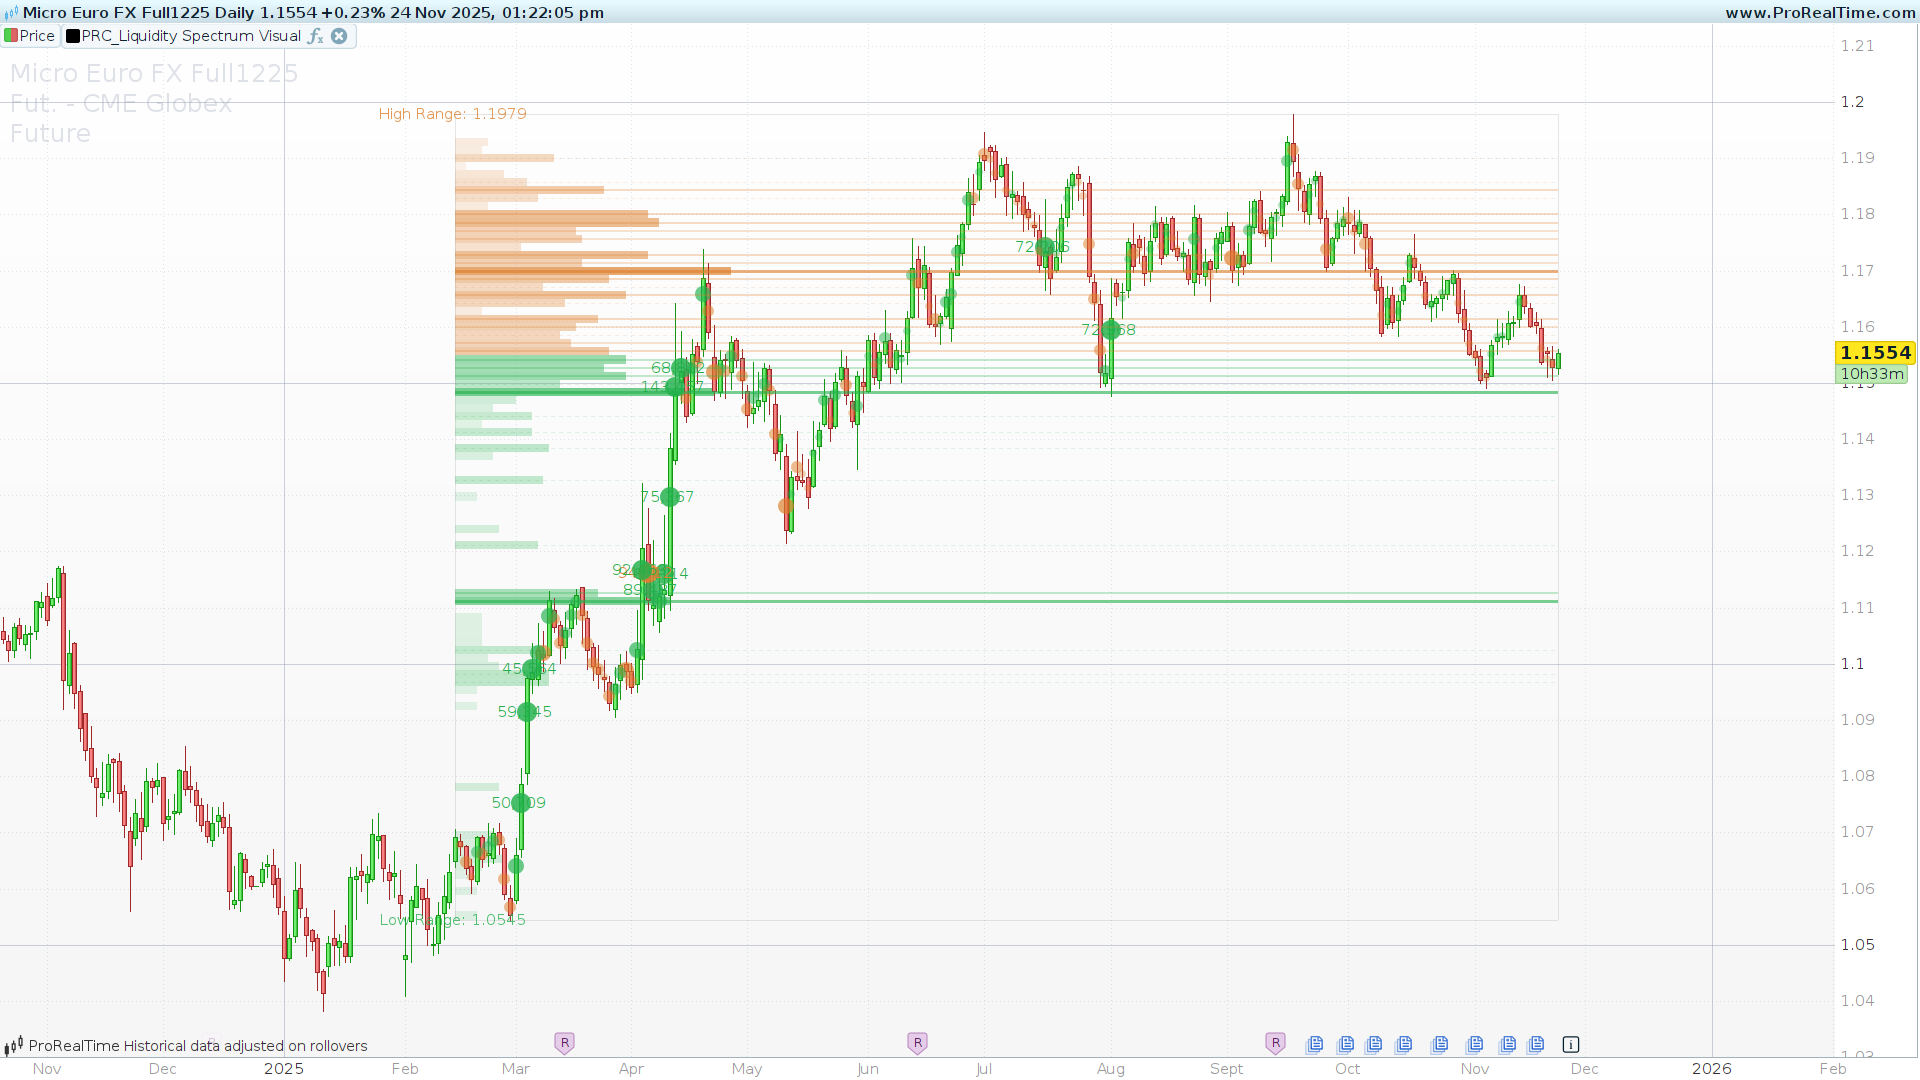
Liquidity Spectrum Visualizer
Author: BigBeluga Date: 24.11.2025
Today, we are presenting the Liquidity Spectrum Visualizer, a comprehensive indicator developed by BigBeluga that combines statistical volume analysis with price-level liquidity mapping.
This tool does not just tell you when volume came in; it tells you where the liquidity is sitting and how significant the current activity is compared to historical norms.
The Concept: A Dual-Engine Approach
The power of this indicator lies in its hybrid engine. It processes market data in two distinct dimensions simultaneously: Time and Price.
1. Volume Bubbles (Time Dimension)
Standard volume bars can be noisy. To solve this, the indicator uses a Z-Score approach based on Standard Deviation.
-
It calculates the Standard Deviation of volume over a defined period (default is 200 candles).
-
It normalizes the current volume against that baseline.
-
The Result: Instead of arbitrary bars, you get Bubbles.
-
A small bubble means volume is within the normal deviation.
-
A massive bubble means volume is 3 or 4 standard deviations from the mean—a statistical anomaly indicating a major institutional event.
-
2. Liquidity Spectrum (Price Dimension)
Using the advanced Array functions available in ProBuilder, the indicator constructs a dynamic Volume Profile directly on your chart.
-
It divides the price range of the lookback period into 100 distinct “bins” or price levels.
-
It loops through historical data, assigning volume to specific price levels rather than specific times.
-
This creates a heat map of liquidity, showing you exactly at what price levels the most shares or contracts have changed hands.
Visual Interpretation
Understanding the chart visualizer is intuitive once you know the color coding and shapes:
1. The Bubbles (Market Aggression)
-
Size: Represents the statistical significance of the volume. A bubble size 4 is a rare, high-impact event.
-
Color:
-
Pine Green: The candle closed higher than it opened (Bullish pressure).
-
Pine Orange: The candle closed lower than it opened (Bearish pressure).
-
-
Labels: If a bubble is statistically extreme (Z-Score ≥ 4), the indicator prints the exact volume number on the chart, alerting you to potential exhaustion or breakout initiation.
2. The Liquidity Lines (Support & Resistance)
To keep the chart clean, the Volume Profile is represented by horizontal lines extending from the left. The style of the line indicates the strength of the liquidity wall:
-
Thick Solid Line: High Liquidity (High Volume Node). These are strong support/resistance levels.
-
Medium Line: Moderate liquidity.
-
Dotted Line: Minimal liquidity. These are “thin” zones where price can move through quickly (Low Volume Nodes).
Configuration and Settings
The indicator is designed to be “plug and play,” but it offers key customizable parameters to fit your trading style:
-
lookback(Default: 200): This defines how far back the indicator looks to calculate the Volume Profile and the Standard Deviation. -
showBubbles(1 or 0): Set to 1 to display the Volume Bubbles, or 0 to hide them if you only want the profile. -
showVP(1 or 0): Set to 1 to display the Volume Profile background. -
showLiqLevels(1 or 0): Set to 1 to draw the horizontal support/resistance lines based on liquidity.
Color Customization: The RGB color variables (rUp, gUp, bUp, etc.) are located at the top of the code. You can tweak these numbers to match your specific template (e.g., changing the Pine Green to a bright Neon Green).
The Code
// --------------------------------------------
// PRC_Liquidity Spectrum Visualizer by BigBeluga
// version = 0
// 24.11.2025
// Iván González @ www.prorealcode.com
// Sharing ProRealTime knowledge
// --------------------------------------------
// Definable parameters (Initial configuration)
// --------------------------------------------
lookback = 200 // Analysis period
showBubbles = 1 // 1 = Yes, 0 = No
showVP = 1 // 1 = Yes, 0 = No (Volume Profile)
showLiqLevels = 1 // 1 = Yes, 0 = No (Liquidity levels)
// --------------------------------------------
// Color Configuration (RGB)
// --------------------------------------------
// Bullish Color (Pine Green type)
rUp = 34
gUp = 177
bUp = 76
// Bearish Color (Pine Orange type)
rDn = 221
gDn = 126
bDn = 42
// -------------------------------------------------------------
// 1. VOLUME BUBBLES CALCULATION
// -------------------------------------------------------------

// Calculate volume standard deviation
volStdev = STD[200](Volume)

// Normalize volume (Simplified Z-Score)
// Avoid division by zero
nVol = 0
IF volStdev > 0 THEN
   nVol = Volume / volStdev
ENDIF

// Determine point size based on volume magnitude
ipointSize = 0

IF nVol >= 1 AND nVol < 2 THEN
   ipointSize = 1
ELSIF nVol >= 2 AND nVol < 3 THEN
   ipointSize = 2
ELSIF nVol >= 3 AND nVol < 4 THEN
   ipointSize = 3
ELSIF nVol >= 4 THEN
   ipointSize = 4
ENDIF

// Determine bubble color
rDraw = rDn
gDraw = gDn
bDraw = bDn

IF Close > Open THEN
   rDraw = rUp
   gDraw = gUp
   bDraw = bUp
ENDIF

// Calculate opacity based on size (larger = more opaque)
alpha = 50 + (ipointSize * 40)
if alpha > 255 THEN
   alpha = 255
ENDIF

// Use typical price (HLC3) for location
myPrice = (High + Low + Close) / 3

// Draw bubbles
IF islastbarupdate and showBubbles THEN
   for i=0 to lookback-1 do
      // Determine point size based on volume magnitude using historical data
      IF nVol[i] >= 1 AND nVol[i] < 2 THEN
         DRAWPOINT(barindex[i], myPrice[i],2) COLOURED(rDraw[i], gDraw[i], bDraw[i], alpha[i])
      ELSIF nVol[i] >= 2 AND nVol[i] < 3 THEN
         DRAWPOINT(barindex[i], myPrice[i],3) COLOURED(rDraw[i], gDraw[i], bDraw[i], alpha[i])
      ELSIF nVol[i] >= 3 AND nVol[i] < 4 THEN
         DRAWPOINT(barindex[i], myPrice[i],4) COLOURED(rDraw[i], gDraw[i], bDraw[i], alpha[i])
      ELSIF nVol[i] >= 4 THEN
         DRAWPOINT(barindex[i], myPrice[i],5) COLOURED(rDraw[i], gDraw[i], bDraw[i], alpha[i])
      ENDIF

      // If volume is extreme (>=4), place text label
      IF nVol[i] >= 4 THEN
         myvol=volume[i]
         DRAWTEXT("#myvol#", barindex[i], myPrice[i]) ANCHOR(TOP,INDEX,VALUE) COLOURED(rDraw[i], gDraw[i], bDraw[i], 255)
      ENDIF
   next
endif

// -------------------------------------------------------------
// 2. VOLUME PROFILE AND LIQUIDITY LEVELS
// -------------------------------------------------------------

IF showVP AND IsLastBarUpdate THEN

   // Find maximum and minimum of the lookback range
   highestPrice = Highest[lookback](High)
   lowestPrice = Lowest[lookback](Low)

   // Define size of each 'box' or bin (100 levels)
   priceRange = highestPrice - lowestPrice
   stepSize = priceRange / 100

   // Clear volume bins array
   UNSET($volBins)

   // LOOP 1: Fill bins with volume
   // Loop through the last 'lookback' candles backwards
   FOR j = 0 TO lookback - 1 DO
      // Get close price and volume of that historical candle
      histClose = Close[j]
      histVol = Volume[j]

      // Calculate which array index corresponds to this price
      // Index 0 is the lowest price, 99 the highest
      binIndex = FLOOR((histClose - lowestPrice) / stepSize)

      // Protect array limits (0 to 99)
      IF binIndex < 0 THEN
         binIndex = 0
      ELSIF binIndex > 99 THEN
         binIndex = 99
      ENDIF

      // Accumulate volume at that price level
      if IsSet($volBins[binIndex]) THEN
         $volBins[binIndex] = $volBins[binIndex] + histVol
      ELSE
         $volBins[binIndex] = histVol
      ENDIF
   NEXT

   // Find maximum volume to scale the drawing (normalization)
   maxBinVol = ArrayMax($volBins)

   // Visual offset (places the VP start at the beginning of the lookback)
   offset = -lookback

   // LOOP 2: Draw profile
   FOR i = 0 TO 99 DO
      // Define Y coordinates (Prices)
      yBottom = lowestPrice + (stepSize * i)
      yTop = yBottom + stepSize
      yMid = (yTop + yBottom) / 2

      // Get level volume
      currentBinVol = 0
      IF IsSet($volBins[i]) THEN
         currentBinVol = $volBins[i]
      ENDIF

      // Calculate bar length (max 50 candles width)
      barLength = 0
      IF maxBinVol > 0 THEN
         barLength = ROUND((currentBinVol / maxBinVol) * 50)
      ENDIF

      IF barLength > 0 THEN
         // Determine level color (if current price is above or below this level)
         rLvl = rDn
         gLvl = gDn
         bLvl = bDn

         IF Close > yMid THEN
            rLvl = rUp
            gLvl = gUp
            bLvl = bUp
         ENDIF

         // Simulated gradient with transparency
         // More volume = more opaque
         alphaLvl = ROUND((currentBinVol / maxBinVol) * 150) + 20

         // RECTANGLE DRAWING (Volume Profile)
         // Draw from the past anchor point to the right
         DRAWRECTANGLE(barindex + offset, yTop, barindex + offset + barLength, yBottom) COLOURED(rLvl, gLvl, bLvl, alphaLvl) BORDERCOLOR(0,0,0,0)

         // LIQUIDITY LEVELS DRAWING (Poc Extensions)
         // If volume is significant (>25% of max), extend a line
         IF showLiqLevels AND (currentBinVol / maxBinVol) > 0.25 THEN

            if (currentBinVol / maxBinVol) > 0.75 THEN
               // Small horizontal line marking the liquidity level (High significance)
               DRAWSEGMENT(barindex + offset, yMid, barindex , yMid) STYLE(LINE, 3) COLOURED(rLvl, gLvl, bLvl, 155)
            elsif (currentBinVol / maxBinVol) > 0.50 THEN
               // Medium significance
               DRAWSEGMENT(barindex + offset, yMid, barindex , yMid) STYLE(LINE, 2) COLOURED(rLvl, gLvl, bLvl, 70)
            elsif (currentBinVol / maxBinVol) > 0.40 THEN
               // Low significance
               DRAWSEGMENT(barindex + offset, yMid, barindex , yMid) STYLE(LINE, 2) COLOURED(rLvl, gLvl, bLvl, 55)
            else
               // Minimal significance (Dotted)
               DRAWSEGMENT(barindex + offset, yMid, barindex , yMid) STYLE(LINE, 1) COLOURED(rLvl, gLvl, bLvl, 35)style(dottedline)
            endif
         ENDIF
      ENDIF
   NEXT

   // Range Maximum and Minimum labels
   DRAWTEXT("High Range: #highestPrice#", barindex + offset, highestPrice) ANCHOR(BOTTOM,INDEX,VALUE) COLOURED(rDn, gDn, bDn, 200)
   DRAWTEXT("Low Range: #lowestPrice#", barindex + offset, lowestPrice) ANCHOR(TOP,INDEX,VALUE) COLOURED(rUp, gUp, bUp, 200)

   // Draw analysis box background
   drawrectangle(barindex+offset,highestPrice,barindex,lowestPrice)coloured("grey",50)
ENDIF

RETURN
